

Logs are essential in modern DevOps environments for debugging, monitoring, and maintaining the health of applications. Grafana Loki is a lightweight, cost-effective log management tool that can replace traditional log management software such as ELK. Loki is compatible with Grafana, Promtail, and other logging tools. This makes it the best log stack for Linux VPS environments.
This guide will show you how to install Grafana Loki, configure Grafana's visualization, and set up Promtail log collection.
How to Install Grafana Loki on a Linux VPS for Log Management
Grafana Loki, a log-aggregation tool inspired by Prometheus, is an aggregation software. It's optimized to store and query logs efficiently, without indexing all log content. Loki stores metadata in a separate location, which reduces storage and improves performance.
Grafana Loki is one of the easiest and most efficient ways to create a log management system that can scale. You get a powerful, lightweight logging stack that is suitable for both production servers and development environments.
Before installing Loki, ensure you have:
- A Linux VPS (Ubuntu/Debian/CentOS/AlmaLinux/RHEL)
- Root or sudo access
- Ports 3100 and 9080 (Loki) are allowed
- Grafana is optional but recommended
Step 1: Create a Dedicated Loki Directory
Create directories for Loki files and config files.
sudo mkdir -p /etc/loki /var/lib/loki
Loki is able to store log files, config files, and chunks of data.
Step 2: Download Loki Binary
Download the latest Loki Release:
cd /usr/local/bin
sudo wget https://github.com/grafana/loki/releases/latest/download/loki-linux-amd64.zip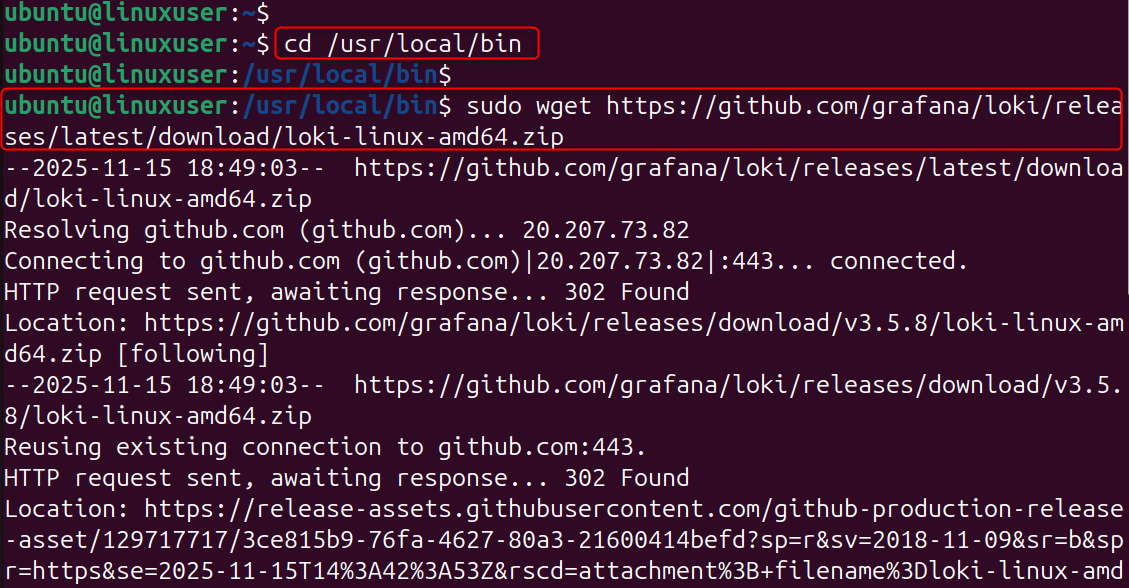
Let’s get the executable permissions:
sudo unzip loki-linux-amd64.zip
sudo chmod +x loki-linux-amd64
sudo mv loki-linux-amd64 loki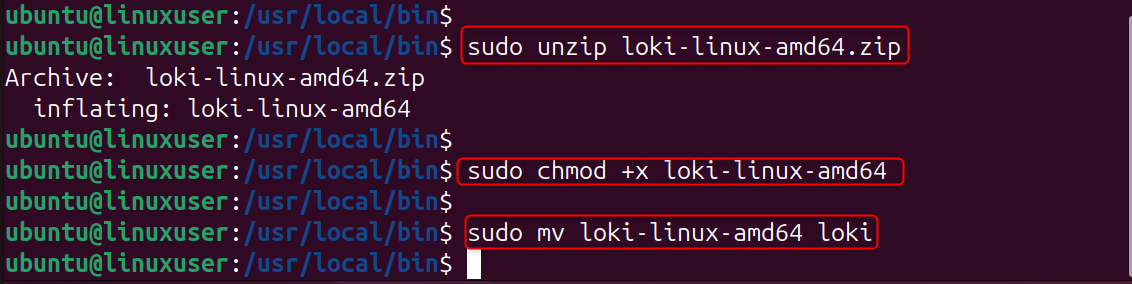
Loki is ready to go.
Step 3: Create Loki Configuration File
Create the main configuration file:
sudo nano /etc/loki/loki-config.ymlCopy the minimal Loki configuration:
auth_enabled: false
server:
  http_listen_port: 3100
ingester:
  lifecycler:
    address: 127.0.0.1
    ring:
      kvstore:
        store: inmemory
      replication_factor: 1
  chunk_idle_period: 3m
  chunk_retain_period: 1m
schema_config:
  configs:
  - from: 2020-10-24
    store: boltdb
    object_store: filesystem
    schema: v11
    index:
      prefix: index_
      period: 24h
storage_config:
  boltdb:
    directory: /var/lib/loki/index
  filesystem:
    directory: /var/lib/loki/chunks
limits_config:
  ingestion_rate_mb: 4
  max_cache_freshness_per_query: 10m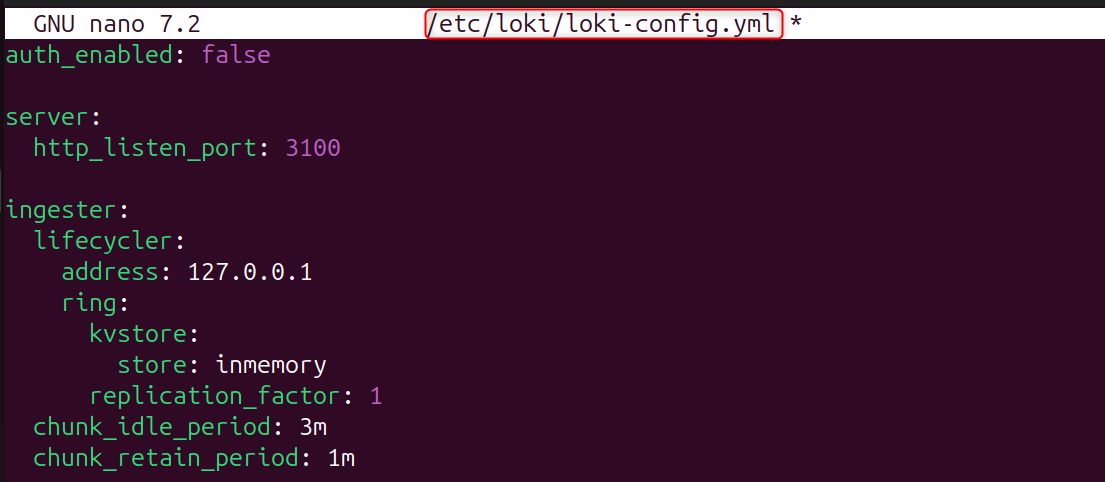
Save and exit.
Step 4: Create Loki systemd Service
Allow Loki to be run in the background:
sudo nano /etc/systemd/system/loki.serviceAdd:
[Unit]
Description=Loki Log Aggregation System
After=network.target
[Service]
ExecStart=/usr/local/bin/loki -config.file=/etc/loki/loki-config.yml
Restart=always
User=root
[Install]
WantedBy=multi-user.target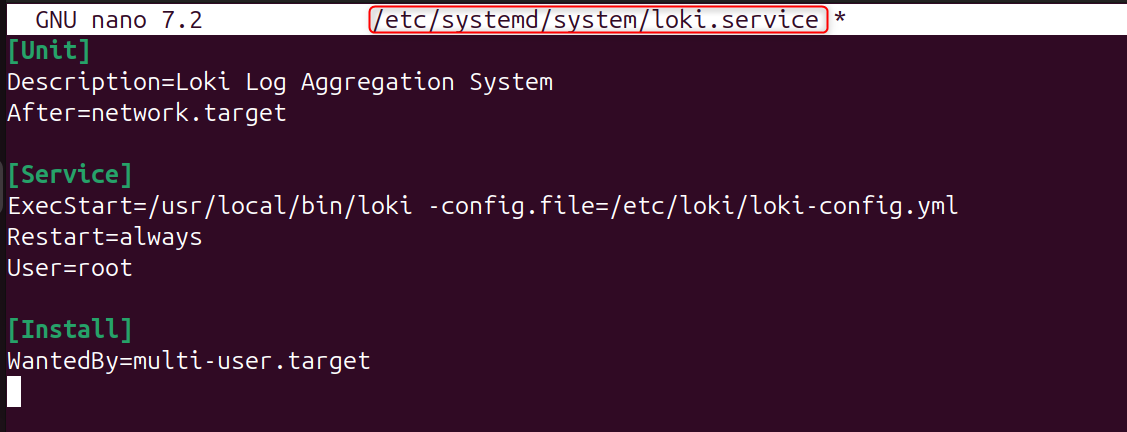
Reload the system:
sudo systemctl daemon-reload
sudo systemctl start loki
sudo systemctl enable loki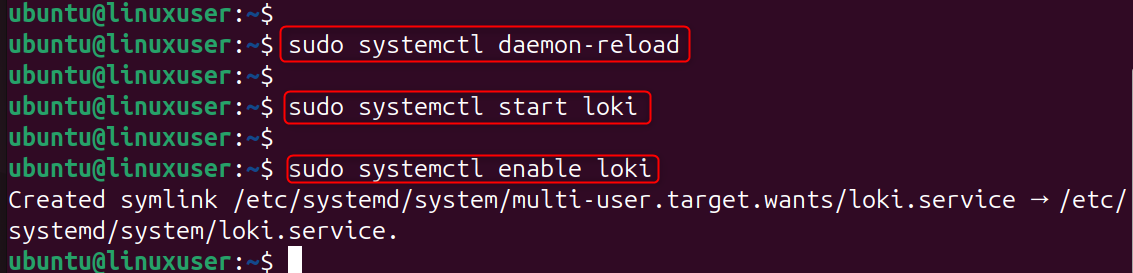
Step 5: Install Promtail (Log Collector)
Promtail sends Loki logs collected from your VPS. Let’s download Promtail:
cd /usr/local/bin
sudo wget https://github.com/grafana/loki/releases/latest/download/promtail-linux-amd64.zip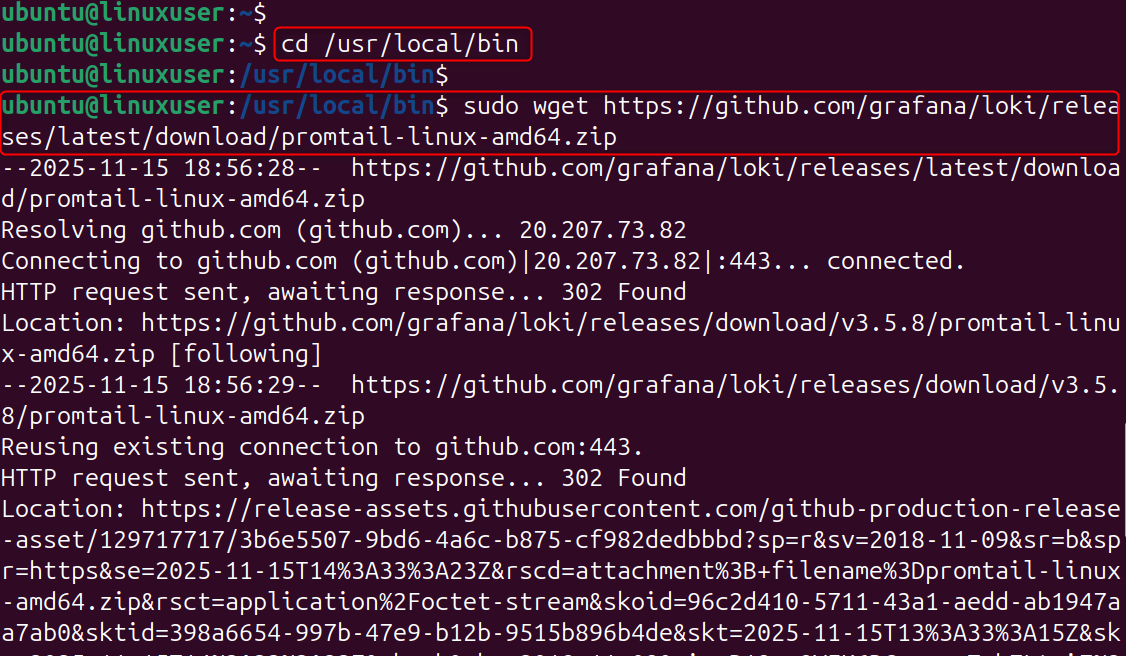
Let’s get the executable permission:
sudo unzip promtail-linux-amd64.zip
sudo chmod +x promtail-linux-amd64
sudo mv promtail-linux-amd64 promtail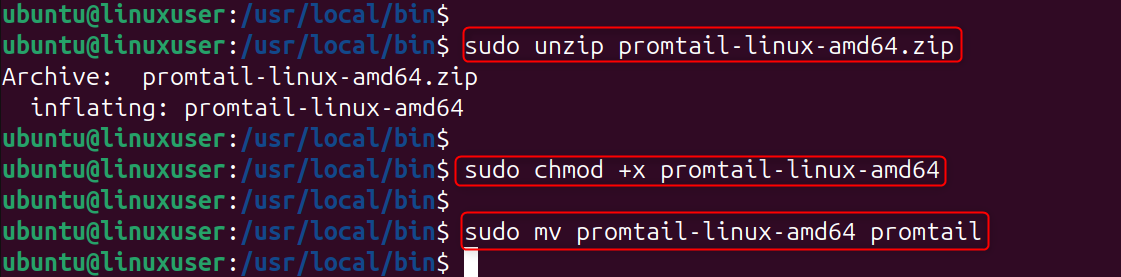
Step 6: Create Promtail Configuration File
Now, create the configuration file:
sudo nano /etc/loki/promtail-config.ymlPaste:
server:
  http_listen_port: 9080
positions:
  filename: /var/lib/promtail/positions.yaml
clients:
  - url: http://localhost:3100/loki/api/v1/push
scrape_configs:
  - job_name: system
    static_configs:
      - targets:
          - localhost
        labels:
          job: syslog
          __path__: /var/log/*.log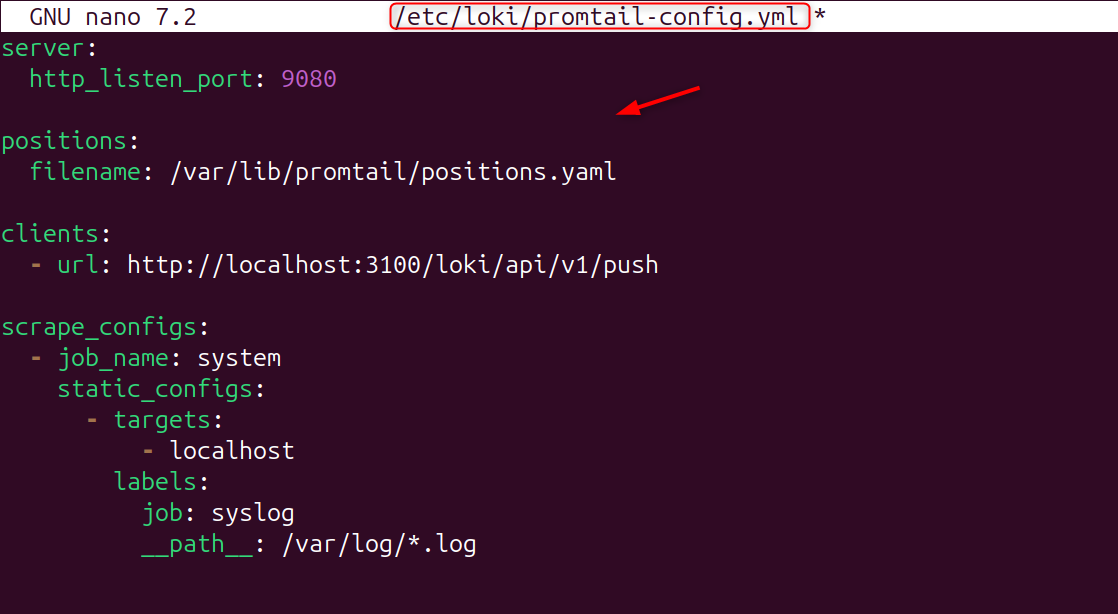
Create the directory:
sudo mkdir -p /var/lib/promtail
Step 7: Create Promtail systemd Service
Now, create the services:
sudo nano /etc/systemd/system/promtail.serviceAdd:
[Unit]
Description=Promtail Log Collector
After=network.target
[Service]
ExecStart=/usr/local/bin/promtail -config.file=/etc/loki/promtail-config.yml
Restart=always
User=root
[Install]
WantedBy=multi-user.target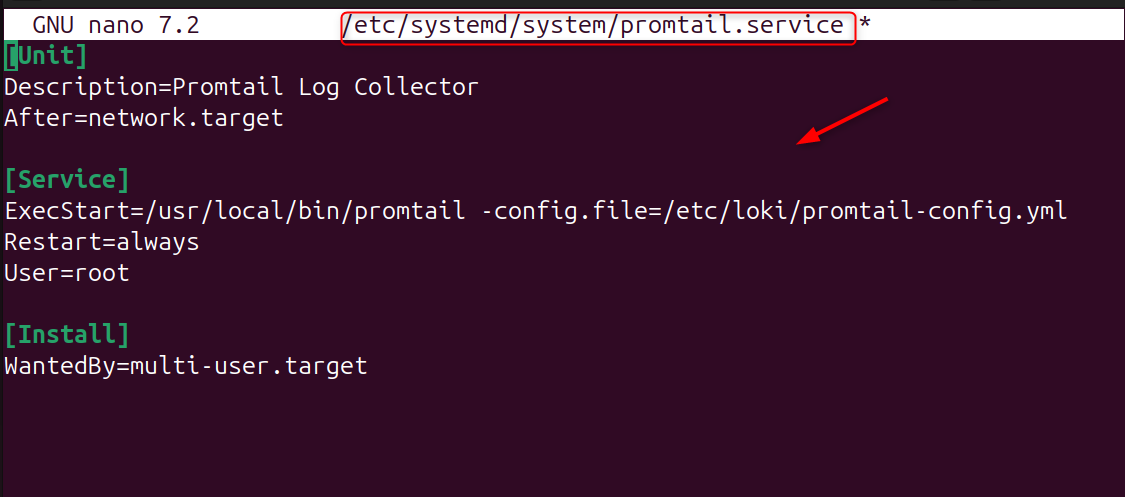
Enable and start:
sudo systemctl daemon-reload
sudo systemctl start promtail
sudo systemctl enable promtail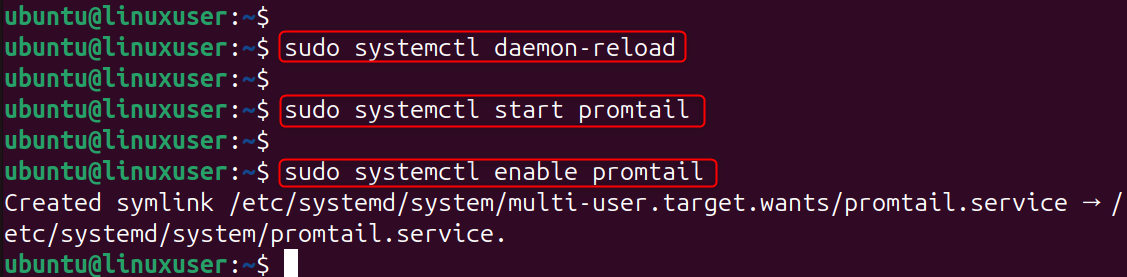
Check status:
sudo systemctl status promtail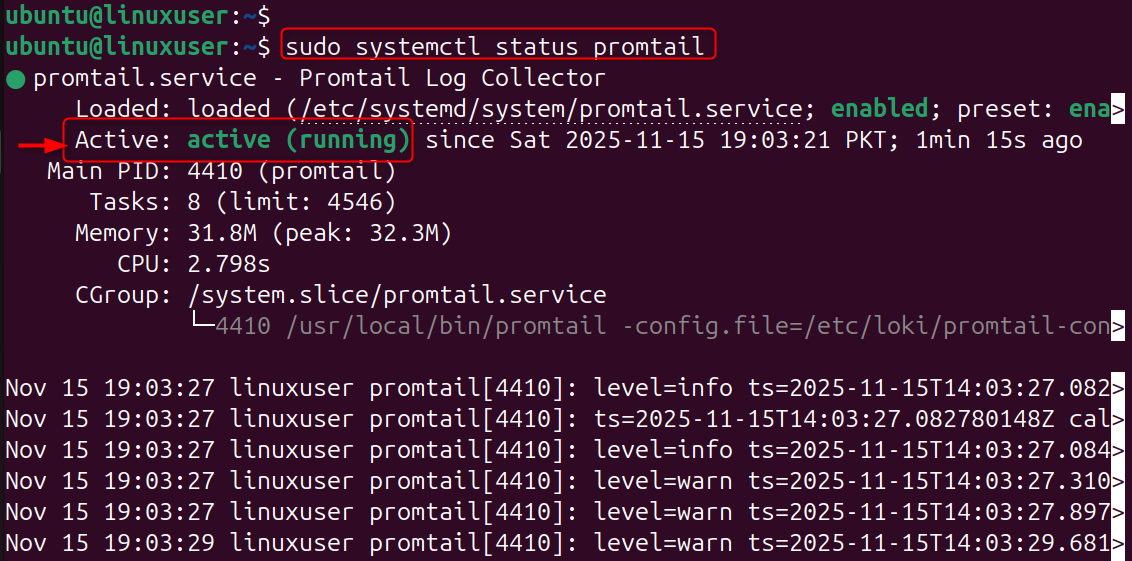
Step 8: Install Grafana (Optional but Recommended)
Grafana enables powerful log visualization. Let’s install:
sudo apt install grafana -y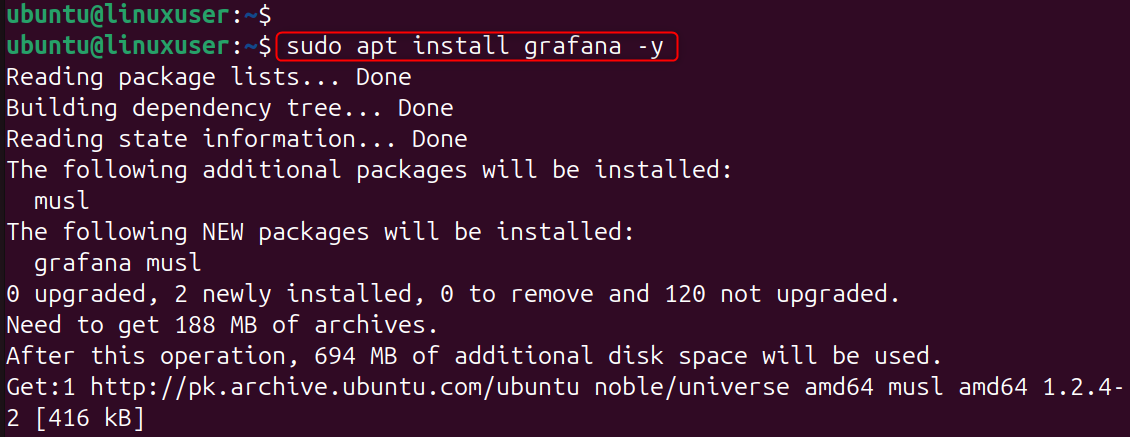
Let’s enable the services of Grafana:
sudo systemctl enable --now grafana-server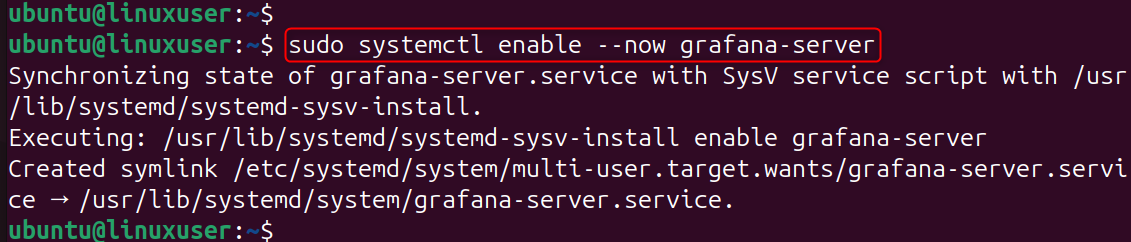
Access Grafana:
http://<your-ip>:3000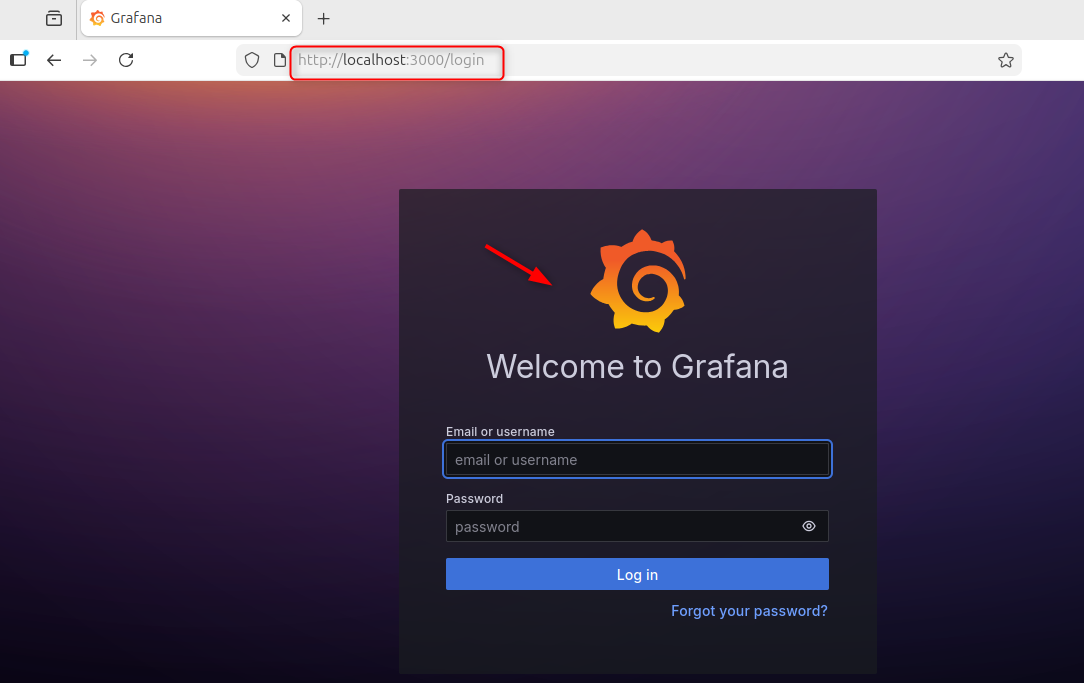
Step 9: Test Your Logging Setup
Run a test log:
logger "Hello from Loki!"
You should now see live logs streaming from your VPS!
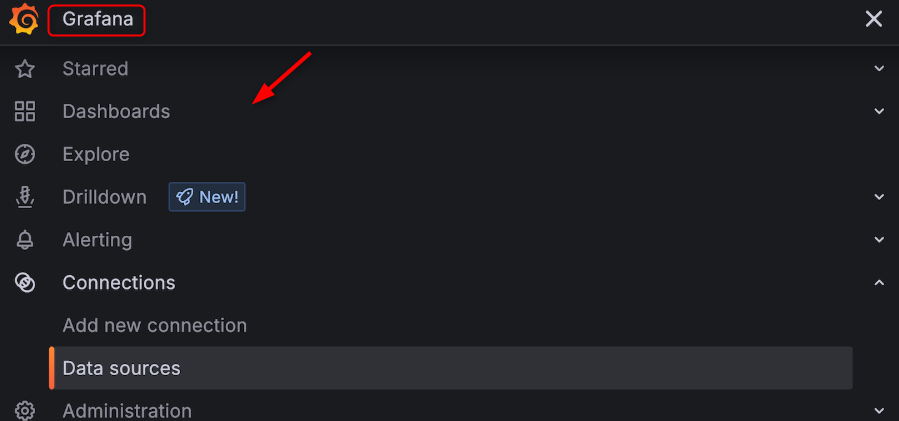
That is all from the guide.
Conclusion
To install Grafana Loki on a Linux VPS for log management, create directories for Loki, download the Loki binary, and place a minimal configuration file in /etc/loki/loki-config.yml, then set up a systemd service to run Loki on port 3100. Install Promtail next by downloading the binary, creating a file that directs logs like /var/log/*.log to Loki, and enabling it as a systemd service. Finally, install Grafana, add Loki as a data source using http://localhost:3100, and start querying logs through Grafana's Explore tab for complete centralized log management on your server.
Do you want to install Grafana Loki on a Linux VPS and manage logs? Consider our Storage VPS solution for your project.
