
When an application fails or slows down on a VPS, diagnosing it quickly is of utmost importance. strace is a Linux tool that traces system calls and signals made by a single process and shows the exact interaction with the operating system. It will show file operations, network activity, and errors in real-time - strace is one of the best tools for debugging applications on a VPS without modifying your code.
A VPS (Virtual Private Server) is an encapsulated, isolated environment that acts like a dedicated Linux server. Developers and system admins use a VPS setup for their websites, APIs, and background services. Because errors most often manifest in production or staging, low-level visibility is essential.
In this article, I will show you how to install and using strace, show some real-world debugging examples, provide you with some tips on filtering the noisy output, and compare strace to other VPS debug tools.
What is strace and How It Works
Strace is a diagnostic tool that allows you to log every system call a process makes, including all of the return results from the kernel. Every action you make in a process, opening a file, writing to disk, sending data over a network as examples, is ultimately impressed into a system call. Strace presents these system calls in consecutive order, and you can use strace output to do a deeper level of analysis.
Strace utilizes the mechanism of attaching to a running process, or starting a program with it. As the process runs, strace waits for the calls and logs them so that you can see arguments, return values, and errors. The live view can assist in tracking what occurs directly before a crash or a slow response.
Strace reveals low level and can connect application behavior to operating system behavior, establishing a reliable diagnostic process to use when sysadmins and developers want to troubleshoot failures in real-time of their VPS.
Why Use strace on a VPS
Virtual Private Server (VPS) environments usually operate critical applications, where any downtime directly impacts users. Applications that log events commonly lose sight of significant details, while strace immediately shows which system call is failing, which file may be missing, or why a connection is timing out.
Measuring strace performance against the alternatives in a VPS in terms of clarity of implementation can be particularly efficient since it typically does not require changing the code. Furthermore, strace usually still works when the application has no logging or very minimal logging. It is particularly good for uncovering issues that only occur in production environments related to missing dependencies, file permission problems, or when a network call hangs.
Because strace allows for tracing processes while they are live, it is a quick means of confirming what the system is doing before you restart services or make a significant change, reducing uncertainty and downtime.
Installing strace on Your VPS
To use strace, you first need to install it on your VPS. This article demonstrates commands for Ubuntu-based VPS environments.If you are using a different Linux distribution, you can install strace with your distribution’s package manager (for example,yum on CentOS or apk on Alpine).
On an Ubuntu VPS, You can install strace using:
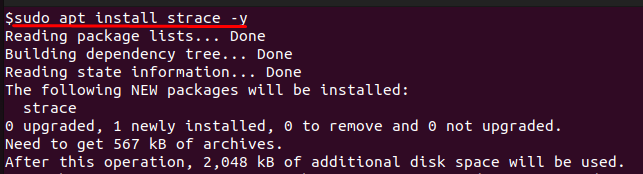
Once installed, confirm that strace is available and check its version:

These commands work on any Ubuntu VPS and ensure that strace is installed correctly before moving on to debugging applications.
Prerequisites
This guide uses commands tested on Debian- and Ubuntu-based VPS distributions. If you are using CentOS, AlmaLinux, or Alpine Linux, simply replace apt with your distribution’s package manager (yum, dnf, or apk). You will need a VPS with SSH access and sudo privileges to install and run strace.
Common strace Use Cases for Debugging on VPS
Debugging Application Crashes
You can run any Linux command under strace to see what it does before it finishes. A simple and safe example is tracing ls, which lists files:
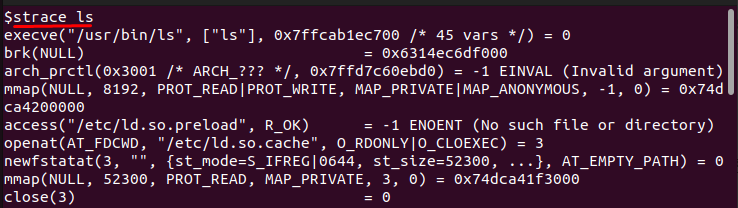
This prints all system calls used by ls to read the current folder. You can scroll through the output and see calls like openat(), read(), and close(). This is exactly what you would do when debugging a crashing program — run it under strace and check what happened just before it stopped working.
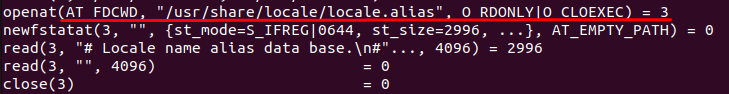
If you want to see a longer-running process and manually stop it, you can trace apt update like this:
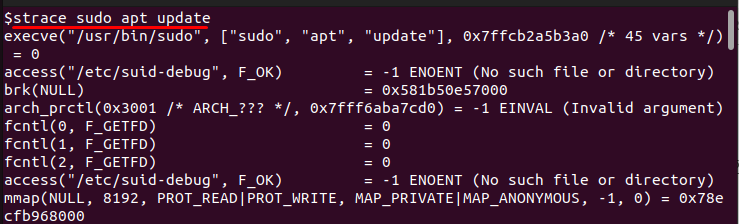
Watch the output for a few seconds, then press CTRL+C to stop strace and the command. This helps you see real activity and lets you capture screenshots without waiting for a crash to happen.
Diagnosing Network Issues
To practice tracing network activity, you can run curl under strace:
The -e trace=network option filters output so you only see network-related calls, like socket() and connect(). If there’s a DNS or connection issue, you would see retries or errors like ENETUNREACH.
You can replace https://example.com with any site you know works or even a site you expect to fail. If it fails, strace will help you confirm whether the failure is due to DNS lookup, TCP connection, or something else.
File Permission Errors
You can simulate a missing file error and trace it with strace to see how it looks. First, run this command with a file that does not exist:
The output will include:

This shows the exact file name the command tried to open and why it failed. If you want to see a permission error, create a file and remove your read permissions:

This time you will see:
These examples make it easy to recognize file-related problems in real applications later.
Performance Bottlenecks
To check timing information and see which calls take the longest, use the -T flag. Try it with a slower command like sleep:

You will see output with time measurements in seconds for each call. The last line will show a nanosleep() call lasting approximately 5 seconds, which confirms the command was paused.
You can also attach strace to a running process. First, find a process ID (PID):
Pick one of the PIDs listed (not the grep one) and run:
Replace <pid> with the number you found. You will now see system calls happening live until you press CTRL+C to detach. This is how you would debug a slow or stuck service on your VPS without restarting it.
Running reliable diagnostics requires a stable and responsive VPS environment. At AlphaVPS, our high-performance VPS plans are built with fast NVMe storage and modern AMD EPYC processors — ideal for running and debugging Linux applications efficiently. Whether you’re tracing processes with strace or troubleshooting live systems, AlphaVPS gives you the performance and stability to do it confidently.
Conclusion
We examined how strace can help developers and system administrators promptly identify the cause of trouble on their VPS. We discussed what strace is, how it works, and provided justification for its merits when logs do not provide enough useful information. You learned how to install it on an Ubuntu VPS, run commands under strace, and attach it to already-running processes to help resolve problems in real-time.
We even discussed when to use strace: identifying explosions of processes, diagnosing unusual network problems, or investigating system bottlenecks. In short, you should now have the skills to record detailed information about system calls, save yourself time by reducing the amount of guesswork, and resume normal use of your VPS by lowering the time to fix problems.
