
Having a Virtual Private Server (VPS) requires vigilance with system logs. Logs track your every action, every error, and every event - these logs become integral in identifying performance issues, troubleshooting, repair, and security. Improper management of your logs can escalate the tiniest of issues into periods of downtime or vulnerabilities.
Logs are the black box of your VPS. Logs provide insight into services, user activities, and events that have occurred, but logs can be cumbersome and difficult to manage and analyze in their raw format.
journalctl is an elegant solution to this problem as it centralizes log files using systemd. journalctl is faster to search with, provides structured storage, is capable of advanced filtering, which is helpful when you need to track a particular event against other events to further monitor and secure your server. In this article, we'll take a look at how to use journalctl to achieve advanced logging and logging management. We'll cover useful commands, persistent logging, log exporting, automating log management, and best practices.
What is Journalctl?
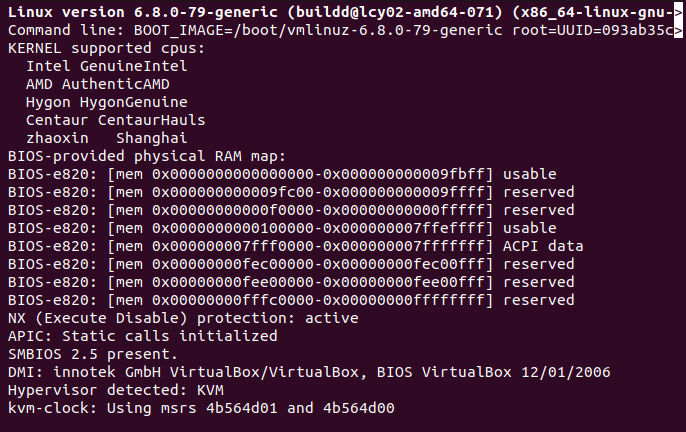
journalctl is a utility that works directly with the systemd journal, which is the logging component of systemd. Instead of using plain text files, it saves log entries to the journal in a binary format, making indexing and structured queries faster. It permits searching logs using fields, such as unit name, PID, UID, or even kernel messages.
The systemd journal gathers data from many sources at once, including kernel logs, service output, syslog messages, and custom application logs, all of which are tagged with time and metadata to filter and analyze later.
In addition, logs can live in memory, on disk, or both, based on how you configure the journal, it allows you to speed and persistence while saving storage space. In summary, journalctl is the interface to this centralized log store and enables you to peruse the logged activity by the system with a level of detail and consistency.
Why Use Journalctl for VPS Log Management?
Logs on a VPS are not just for debugging. They serve several purposes:
- Monitoring services like Nginx, Apache, MySQL, or SSH.
- Detecting intrusions such as failed login attempts.
- Auditing changes made by users and applications.
- Optimizing performance by analyzing service failures and resource usage.
With journalctl, you can do all of this faster and more efficiently. It reduces guesswork and keeps you in control of your VPS.
If you’re running production workloads or managing multiple environments, it’s important to have a reliable platform underneath your VPS. Our High-Performance VPS plans are optimized for monitoring-heavy and systemd-based workloads — with fast NVMe storage and AMD EPYC CPUs ensuring consistent performance while you analyze logs or tune your infrastructure.
Basic Journalctl Commands
Here we will discuss the fundamental commands that every VPS administrator should know. These commands form the foundation for exploring logs and will prepare you for more advanced filtering later in the article.
View all logs
It is important to understand the overall picture of your system activity before diving into specific issues. By looking at all logs together, you can detect unusual events or recurring patterns:
This command shows the complete log history in chronological order.
Follow logs in real-time
When troubleshooting live issues, watching logs as they are written can save a lot of time. It allows you to see service responses, errors, or security alerts the moment they occur:
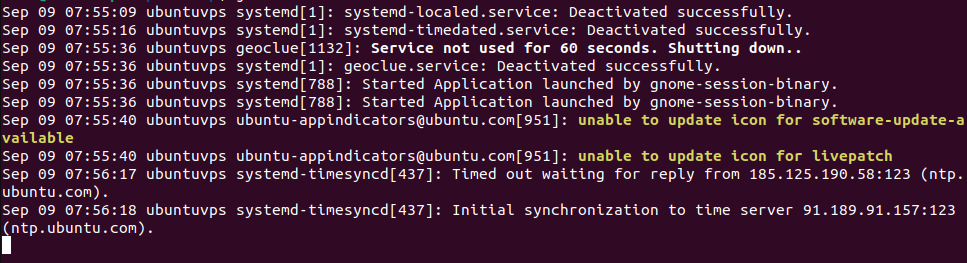
This works like tail -f and streams log entries as they are generated.
View logs since last boot
Every time your VPS restarts, it creates a new boot session. Checking logs from the last boot helps confirm whether services started correctly or if errors appeared during initialization:
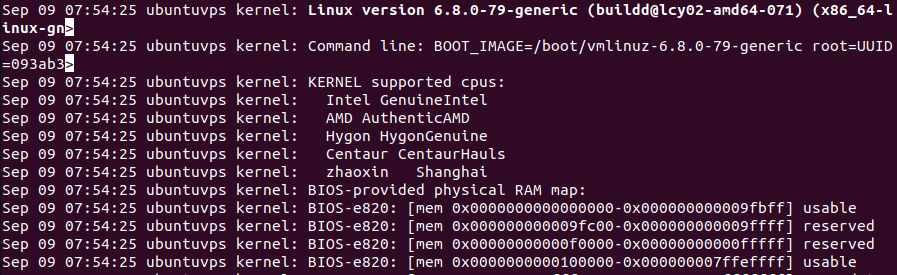
This displays all log entries generated since the most recent system startup.
Advanced Journalctl Usage
Once you are comfortable with the basics, you can move on to more powerful ways of querying logs. These options let you focus on specific timeframes, services, or system boots, which is essential for accurate troubleshooting.
Filter logs by time range
When investigating a problem that occurred at a known time, narrowing logs to that period saves effort. Instead of scrolling through days of entries, you can pinpoint exactly what happened in that window:
This command displays only logs between the given start and end dates.
View logs for a specific service
Most issues on a VPS are tied to a particular service, such as a web server or database. Focusing on one unit’s logs helps you isolate and fix errors without distraction from unrelated entries:
You can replace nginx.service with any other service, like mysql.service or ssh.service.
Check logs for the previous boot
Problems don’t always appear in the current session. Reviewing logs from earlier boots can reveal crashes, failed updates, or startup errors that no longer show in live logs.
This pulls entries from the system boot before the current one.
Persistent Logging on VPS
By default, systemd journals may only be stored in memory, which means logs disappear after a reboot. For VPS administrators, this is a problem because it removes valuable history needed for audits and troubleshooting. You can enable persistent logging so logs survive across restarts.
To set up persistent storage:
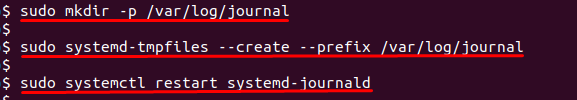
These commands create a directory for permanent log storage and restart the journal service to apply the change.
Optimizing Journal Size and Storage
On a VPS with limited disk space, uncontrolled log growth can cause storage issues. Managing the size of the journal ensures logs remain useful without filling the disk.
Check how much space the journal is using:

This shows the total size of all stored logs.
If needed, adjust the maximum size by editing the configuration file:
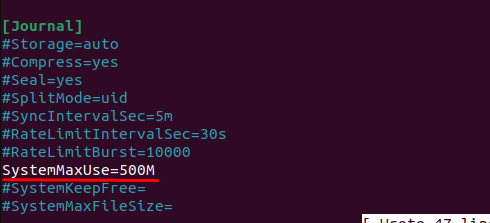
Restart the service to apply changes:
This configuration limits journal logs to 500 MB, preventing storage overload.
Exporting and Saving Logs
There are times when you must archive logs for compliance, share them with support teams, or analyze them offline. Exporting logs makes this process straightforward.
Export all available logs to a text file:
Export logs for a specific service:
These exported files can be stored, reviewed, or attached to tickets when reporting issues.
Journalctl for Security and Auditing
Logs also serve as a defense mechanism. They reveal failed login attempts, suspicious activities, and possible break-in attempts. Checking them regularly helps maintain a secure VPS.
To track failed SSH login attempts:
To spot authentication errors:
By watching these logs, you can quickly identify brute-force attacks or unauthorized access attempts.
Conclusion
A stable VPS necessarily involves reliable log monitoring, and in this regard, we're fortunate - journalctl offers a very complete monitoring solution. Journalctl provides administrators with reliable access to both real-time and past system log monitoring, assisting in troubleshooting and system fine-tuning. Many of its available advanced options include filtering by time or service, viewing previous boots, and persistent logging, which maximizes content recovery and minimizes captured content loss.
In addition to monitoring day-to-day activity, journalctl adds to the longer-term stability and security posture of your VPS. You can manage storage availability, export logs for auditing, make use of cron jobs to automate cleanup, and recognize threats to your VPS and/or systems through regular log monitoring. Not only do these functions work together to help you monitor the performance of your VPS, they also reinforce the security and maintenance of operations of your VPS - implementing journalctl into your operations should be reason enough that it must be considered an essential log management tool.
