Disk I/O measures the speed of how quickly a server reads/writes to storage. On a Linux VPS, slow I/O will restrict applications, slow down response times to users, and ultimately create an unsatisfactory user experience. Dissecting, monitoring, and understanding these issue, will help to identify a bottleneck before it accelerates to a damaging performance impact.
The iostat command provides administrators a direct representation of CPU usage and disk operations as they occur simultaneously. By focusing on throughput and workloads, iostat is able to isolate and track trends that contributes to inefficiencies at the system level. iostat has a broad domain that tracking direct disk operations while other monitoring commands have a focus on some other unrelated aspect of the system operations, the relationship between storage, and CPU usage.
iostat will most benefit system owners and administrators that rely heavily on the disk via databases, file servers and busy websites. In this article, you will learn about disk I/O, how to install the iostat command, how to use the command and how you analyze the output to chase down performance issues.
What is Disk I/O and Why Does it Matter for VPS?
Disk I/O is the speed a system can read and write to its disks. Every time data is read from or written to disk, it passes through an I/O layer. As such, I/O layer will directly impact how quickly an application can respond to a request. A VPS that has a good I/O subsystem has a consistent workload; whereas, weak I/O will introduce delays that build up when handled in volume.
A high I/O wait is when the CPU is waiting for data from disk to begin further processing. In a high I/O wait state, system throughput drops because the processing power is wasted since it is idle rather than executing processor instructions. If I/O performance is poor, it does not matter how many CPUs you are using when the underlying storage cannot finish a task in a timely fashion.
In regards to I/O, always remember that applications that are data access heavy will usually put more stress on I/O than any other aspect of your VPS. Databases/seek applications, do several queries, only want fast reads and writes. Large file transfer applications want a sustained throughput for an extended time. Backups primarily cause a significant amount of sequential writes. All I/O activity must be monitored and managed. Otherwise, without monitoring, you could fill up your storage capacity and slow the VPS as access to diverse services are limited.
Prerequisites
This guide is written for Debian-, Ubuntu-, CentOS-, and Fedora-based Linux VPS environments.
Before proceeding, make sure you have:
- A Linux VPS with SSH access and
sudoprivileges. - Basic familiarity with the command line to run and interpret
iostatoutput. - The ability to install packages using your system’s package manager (
apt,yum, ordnf).
Having these in place ensures that you can install and use iostat without interruptions.
Installing iostat on a Linux VPS
The iostat command is part of the sysstat package and serves as a lightweight utility for monitoring disk and CPU activity. It collects statistics from the kernel and presents them in a readable format, making it easier to evaluate how storage devices interact with processing resources.
By showing both CPU usage and device performance together, iostat reveals whether delays originate from the processor or the disk. Because it is small, fast, and built for command-line use, iostat suits environments where efficiency matters.
To use it, the package must first be added through the system’s package manager.
On Debian or Ubuntu, run:
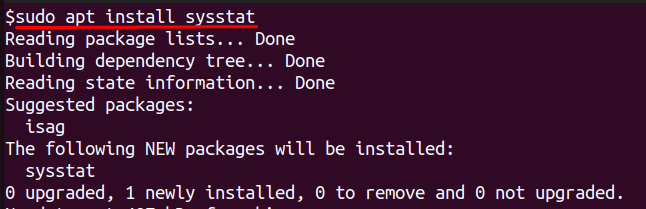
This installs the sysstat package and makes iostat available for immediate use.
On another Linux VPS, you can install it using the below commands:
It ensures that the latest sysstat tools are placed on the system. Once configured, the VPS is ready to produce disk and CPU usage reports.
Practical Examples of Using iostat
The iostat command supports several flags that reveal different types of system information. Each variation helps identify performance issues and storage bottlenecks.
Viewing Basic CPU and Disk Statistics
To get a quick overview of CPU usage and disk activity in a single snapshot, run:

This shows overall CPU time along with read and write activity for each device. If total disk activity is unusually high during normal workload, it may signal an application writing or reading excessively.
Checking Detailed Device-Level Metrics
For a deeper look into disk health and latency, use:
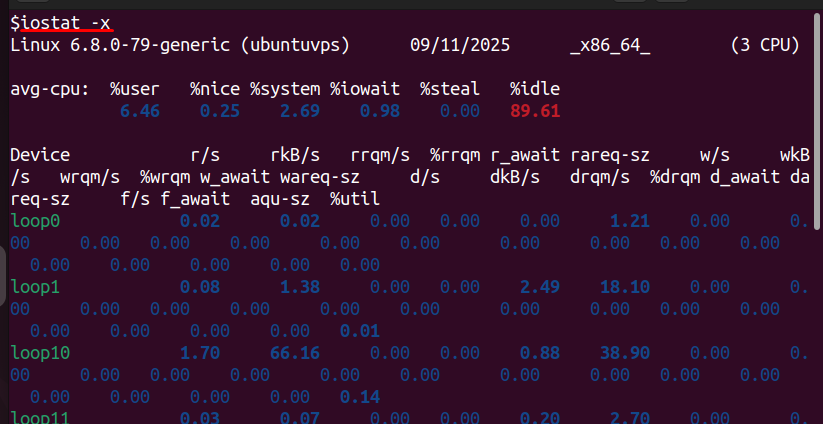
This displays extended statistics such as device utilization, average request size, and service time. High utilization with long service times indicates the disk is overloaded or struggling to handle requests, which is a common cause of slow response times.
Monitoring Disk Activity Over Time
To watch how performance changes during load, use:
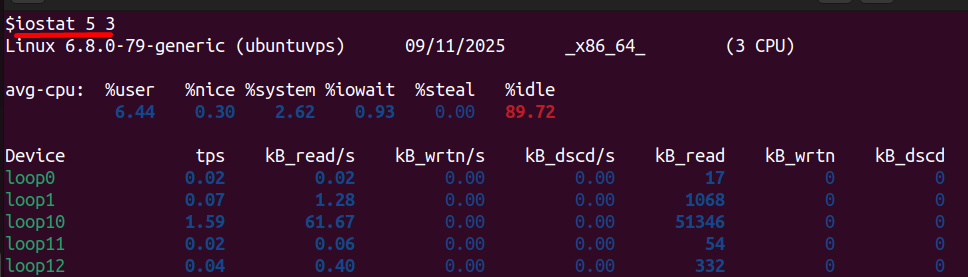
This updates the output every five seconds for three cycles. If I/O wait spikes in every cycle, it confirms that the VPS consistently stalls due to slow storage rather than random short-term spikes.
Viewing Output in Megabytes
For servers with large transfers, viewing data in MB makes analysis easier:

This converts all disk read and write figures from KB to MB, making throughput comparisons clearer. Low throughput despite heavy activity may mean the storage device is processing many small requests inefficiently.
Monitoring a Specific Disk
If you want to focus on one device only, run:
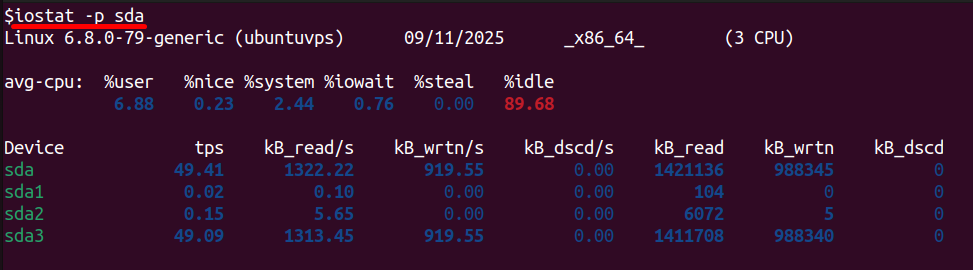
This isolates the selected disk and shows its individual performance. This helps confirm whether only one disk is saturated while others remain idle.
Checking CPU Metrics Without Disk Statistics
When the goal is to verify CPU stalls caused by storage delays, use:
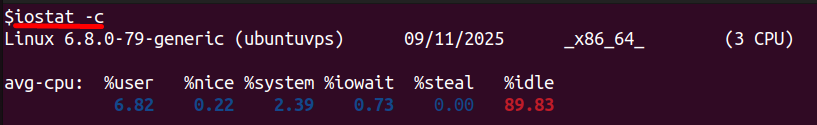
This displays CPU breakdown including I/O wait. A consistently high percentage in the I/O wait field means the processor is spending too much time waiting for disk responses.
By using these variations together, you not only collect performance data but also pinpoint where delays come from — whether it is excessive disk load, high request latency, or CPU idle time caused by storage wait.
Identifying Disk Bottlenecks with iostat
After getting through analyzing iostat using various flags, the next step is to examine the numbers in detail. High I/O wait indicates the processors have too much idle time, which indicates that the storage is too slow. Continued utilization close to 100% indicates disk saturation and therefore would not accommodate more workload. Long service times with increased queue depth then indicate that requests are taking longer than expected to complete.
Throughput values that remain low with high-level transactions indicate that the operations are small and fragmented and therefore high overhead. Viewing these metrics together will allow administrators to separate activity that is part of regular operations from true performance problems and then make decisions about whether to optimize their workload, balance it differently, or consider upgrades to their storage.
Monitoring tools like iostat are most useful when paired with reliable hardware and optimized storage. At AlphaVPS, our RAID-protected Storage VPS plans and High-Performance VPS options deliver consistent, low-latency disk performance — ideal for database workloads, backups, and heavy I/O operations. Combined with proper monitoring, they ensure your VPS remains stable and responsive under load.
Conclusion
Keeping an eye on disk I/O is one of the most effective tools in getting your Linux VPS to run effectively. The iostat tool provides a clear understanding of how storage performance interacts with CPU usage and provides visibility to help troubleshoot bottlenecks before they affect their end users. By installing and configuring iostat will allow administrators to monitor system health in real time and make data-driven decisions regarding resource management.
In this guide, we have examined the various iostat options and flags available that provide CPU load, disk throughput, and latency at differing detail levels. With these data points, VPS owners can see if bottlenecks arise from slow disks, too high of I/O wait, or workload overload. All of which can help determine how to keep their VPS performant, their resources balanced, and to maintain a stable and responsive server environment.
