A Virtual Private Server (VPS) needs constant monitoring to ensure smooth performance. When CPU, memory, or disk usage goes unchecked, even a small spike can slow down applications or cause downtime. Identifying the source of resource consumption is the first step toward fixing such issues.
On Ubuntu VPS, two reliable tools simplify this task: htop and atop. Htop gives you a live view of processes, CPU cores, memory, and system load in a clean interactive interface. Atop, on the other hand, keeps detailed historical logs that help trace resource usage at a specific time, even after the issue has passed.
Using both tools together allows you to catch problems in real time and analyze past performance trends. This combination ensures better visibility of how your VPS behaves under different workloads. In this article, we will cover installation, essential commands, practical use cases, and monitoring workflows for htop and atop on Ubuntu VPS.
Why Monitoring Resource Usage on VPS is Important
A VPS runs on shared physical hardware, so your server’s stability depends on how well you manage the allocated resources. Without regular monitoring, small issues can escalate into downtime or poor performance.
Key reasons include:
- Prevent downtime and slow performance – Tracking CPU, memory, and disk usage helps spot bottlenecks before they disrupt services.
- Identify misbehaving processes – Some tasks overconsume resources, leading to CPU bottlenecks or memory leaks. Monitoring makes it easy to detect and stop them.
- Optimize server resources – Hosting apps, websites, or databases requires balanced usage of CPU, RAM, and disk I/O. Monitoring reveals where adjustments or upgrades are needed.
- Detecting unusual activity – Sudden spikes in network or disk usage often signal brute-force attacks or abnormal traffic, allowing quick security responses.
- Consistent monitoring ensures efficient VPS resource tracking, better server optimization, and reduced risk of unexpected failures.
Prerequisites
This guide is written for Debian- and Ubuntu-based VPS environments.
Before getting started, ensure you have:
- A VPS with SSH access and
sudoprivileges. - A recent Ubuntu or Debian release (20.04 or later recommended).
- Basic familiarity with using the Linux command line.
If you are using a CentOS or Fedora VPS, you can install both tools with your distribution’s package manager (yum or dnf) instead of apt.
Installing htop and atop on Ubuntu VPS
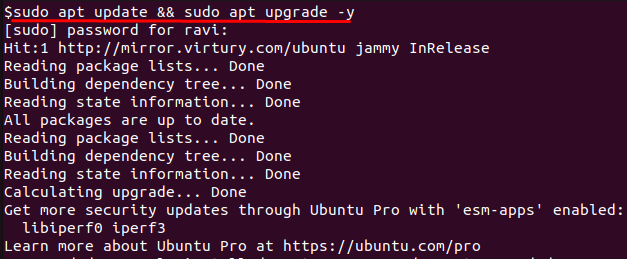
Start by updating the package lists and upgrading existing software to make sure your system is running the latest versions. This step ensures security patches are applied and prevents compatibility issues when adding new tools.
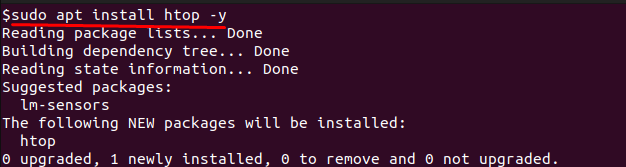
With the system updated, install htop by running:
Next, install atop using:

Both commands work on Ubuntu VPS and provide you with the necessary monitoring tools once installation completes.
How to Use htop to Monitor Resource Usage
Launching htop
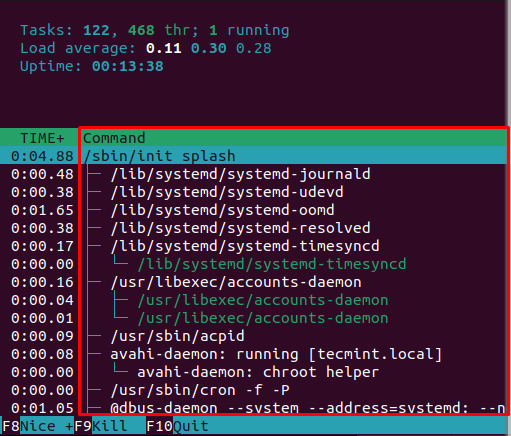
To start monitoring, open your terminal and run:

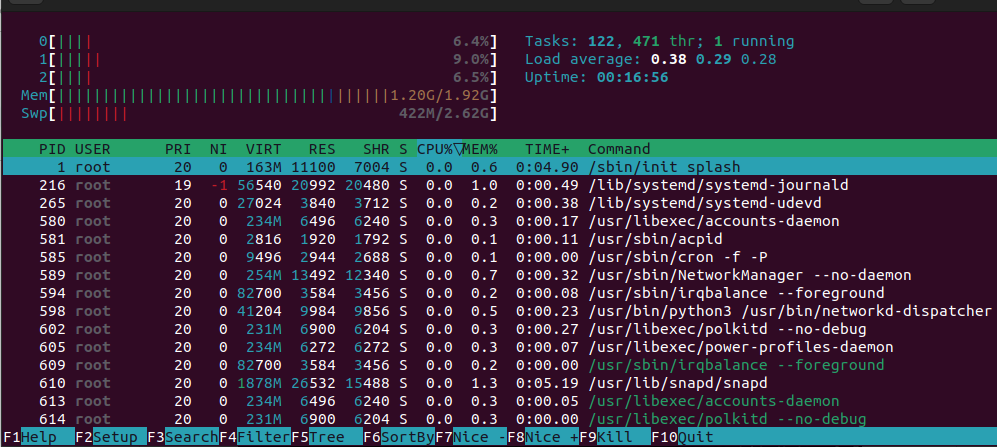
This opens a real-time interactive interface that shows CPU usage, load averages, memory consumption, and running processes in a clean and scrollable format. The display updates continuously, making it easier to spot resource spikes and heavy processes.
Using htop Shortcuts
When you press F2, the setup menu opens. From here, you can customize the interface by adding or removing columns, adjusting colors, or changing what data appears on the screen:
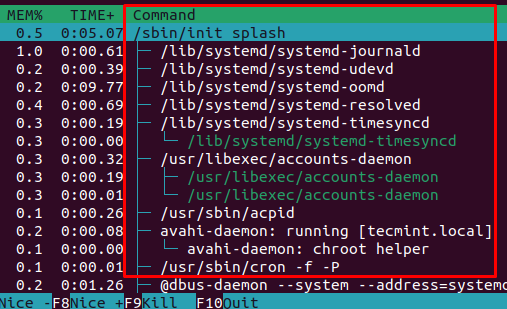
If you want to view processes in a hierarchical order, press F5 to switch into tree view. This makes it easy to see which processes were started by others:
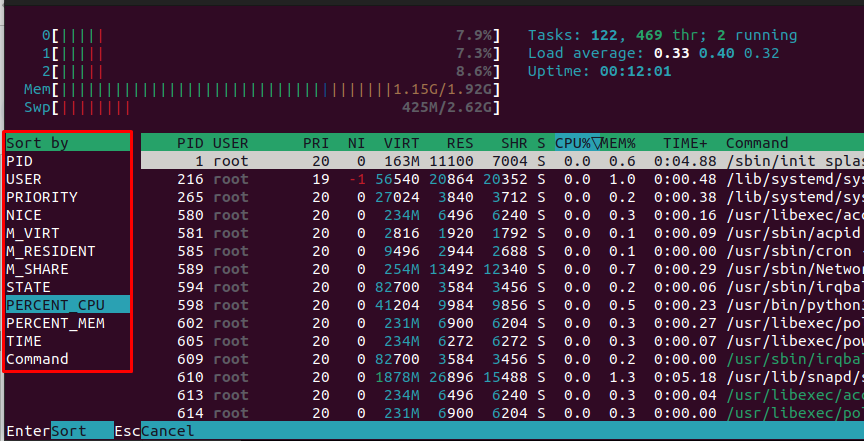
When you press F6, you can change the sorting criteria. For example, you might choose to view processes sorted by memory usage instead of CPU:
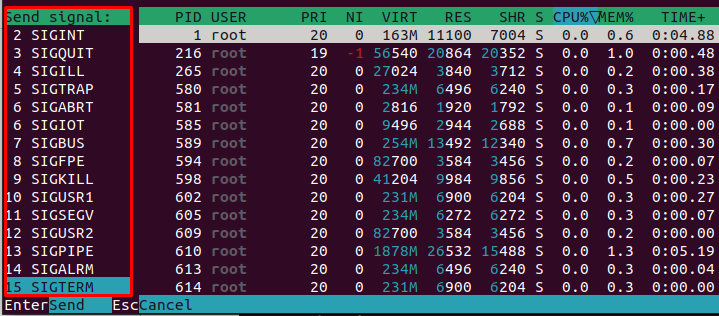
To stop a process, highlight it and press F9. This allows you to kill the selected process by sending a signal, which is often the quickest way to deal with unresponsive tasks:
Useful htop Flags
If you want to slow down how often the interface refreshes, you can use the -d option:
This sets the refresh delay to two seconds instead of the default half-second, reducing CPU overhead.
If you only want to monitor processes owned by a specific user, use the -u option:
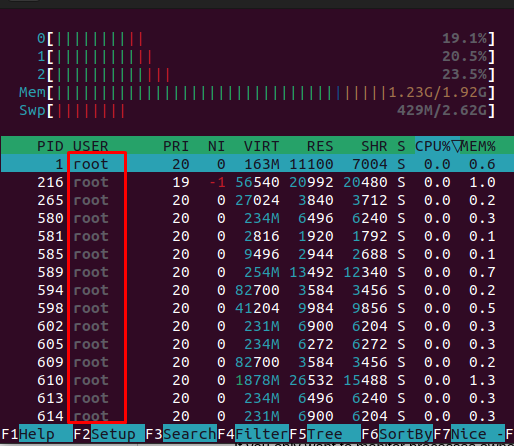
This displays only processes belonging to the root user, which is helpful when monitoring web server activity.
Sometimes you may want to focus on a particular process. The -p option lets you specify process IDs:
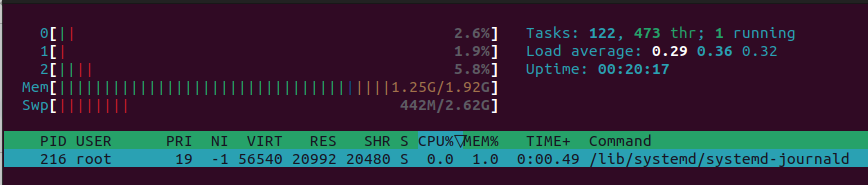
This launches htop, showing only the processes with those IDs, making it easier to isolate a service.
You can also choose to sort processes by a specific column at launch with the -s option:
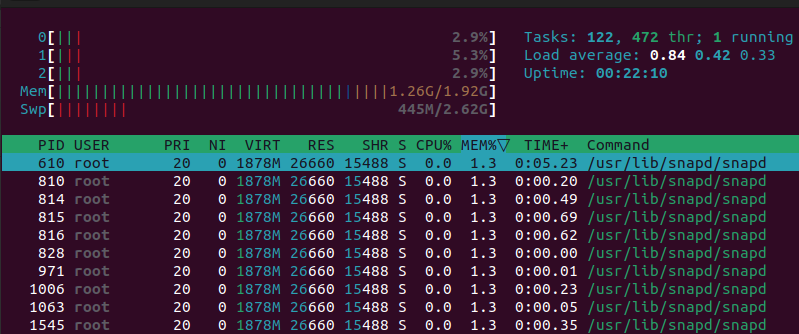
This opens htop with the list sorted by memory usage. Other options include PERCENT_CPU or TIME.
How to Use atop to Monitor Resource Usage
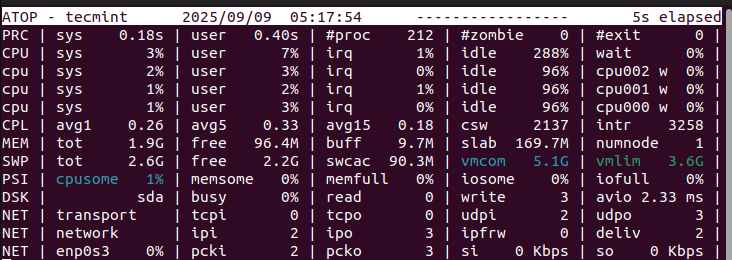
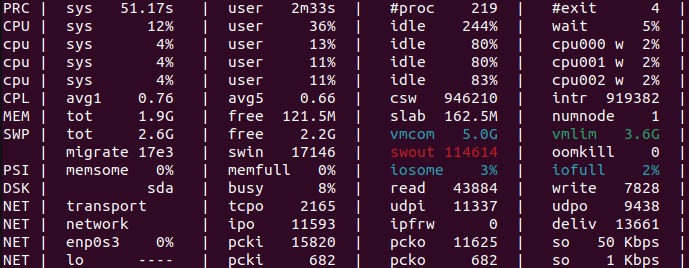
To start atop, simply run the following command in your terminal:
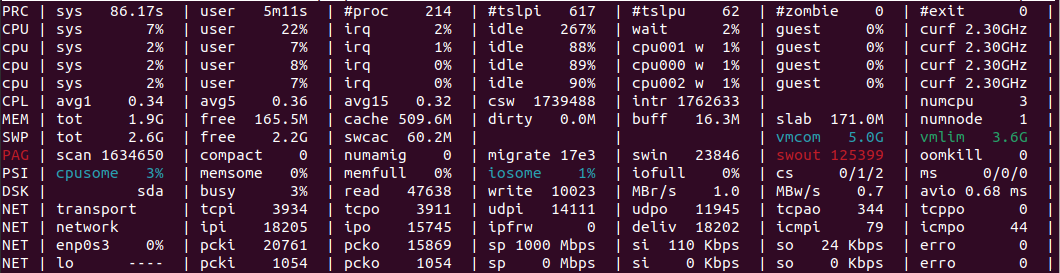
This opens a detailed real-time interface showing CPU, memory, disk, and network usage. Unlike simple process monitors, atop collects extended statistics, which makes it a valuable tool for tracking how resources are being consumed over time.
Using atop Shortcuts
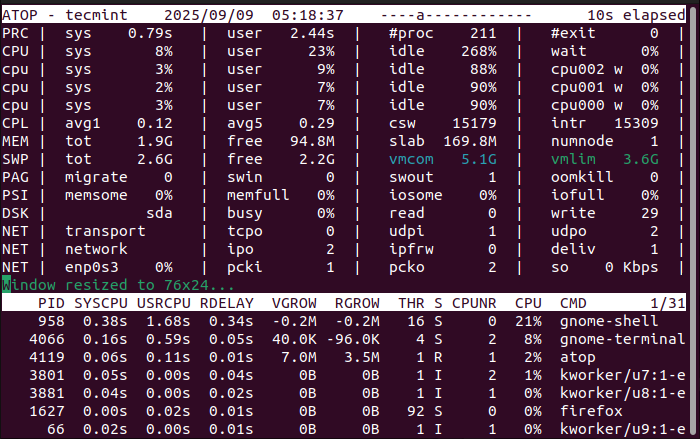
When you press t, the display switches to focus on threads. This is useful when you want to see detailed activity within multi-threaded applications:
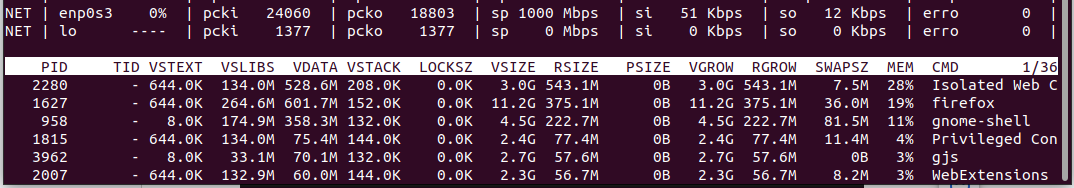
If you press m, the memory view becomes active. This highlights how RAM and swap space are being allocated across different processes:

Pressing n displays network-related activity, allowing you to see bandwidth consumption per process.
Useful atop Flags
If you want atop to update less frequently, you can specify the refresh interval when launching it. For example:
This refreshes the display every five seconds instead of the default ten.
You can also use the -r flag to read previously saved log files:
This shows historical performance data, which is useful for troubleshooting past issues.
If you want to write monitoring data to a file for later review, use the -w option:
This continuously records system activity into the specified file until you stop it.
For more detailed output that includes all processes, even short-lived ones, you can use:
This ensures you don’t miss activity from processes that start and end quickly.
Enabling atop Logging Service on Ubuntu
One of the biggest advantages of atop is its ability to log performance data automatically at regular intervals. This feature lets you analyze what happened on your server even after a problem has passed.
To enable the logging service, first check its status:

If it’s not active, enable and start it with:
By default, atop saves its logs under /var/log/atop/. Each day a new log file is created, and you can review past activity with the -r flag. For example:
This way, atop becomes more than just a live monitoring tool—it also works as a historical tracking system for CPU usage, memory leaks, disk bottlenecks, and network spikes.
Comparing htop vs atop: Which One Should You Use?
htop for Real-Time Monitoring
htop is designed for lightweight, real-time process monitoring. When you launch it, you immediately see how CPU cores, memory, and swap are being used. Its interactive shortcuts let you sort, search, and kill processes on the fly. Because it is fast and responsive, htop is ideal for day-to-day monitoring and quick troubleshooting on a VPS.
atop for Historical Analysis
atop goes beyond real-time data. It records detailed logs about CPU, memory, disk, and network usage, even for short-lived processes that might otherwise go unnoticed. This makes it especially useful for historical analysis and diagnosing performance issues that happened in the past. With its logging service enabled, atop works as a continuous tracking system for deeper performance investigations.
Recommendation
The best approach is not to treat them as competing tools but as complementary ones. Use htop when you need immediate insights into what is happening right now, and rely on atop when you need to analyze longer-term trends or investigate issues after they occur. Together, they provide a complete solution for VPS performance monitoring and Linux server optimization.
Reliable performance monitoring goes hand in hand with a stable hosting environment. At AlphaVPS, our High-Performance VPS and Ryzen VPS plans provide consistent CPU and memory performance, ideal for workloads you monitor with tools like htop and atop. For long-term data collection or backup-heavy environments, our Storage VPS ensures smooth disk I/O and dependable throughput under any load.
Conclusion
Effective Linux VPS performance monitoring is the key to preventing downtime, avoiding resource bottlenecks, and ensuring smooth server operations. On Ubuntu VPS, tools like htop and atop provide complete visibility into how your server consumes CPU, memory, disk I/O, and network resources. Htop excels at real-time process management with its interactive interface, while atop adds value through historical logging and detailed resource usage analysis.
Together, they form a powerful combination for both immediate troubleshooting and long-term Ubuntu server optimization. Whether you’re managing websites, applications, or databases, regularly monitoring with htop and atop ensures your VPS stays stable, secure, and efficient under any workload. Proactive monitoring not only improves performance but also strengthens your overall server reliability.
