In today's data-driven world, managing time series data is crucial for analytics and monitoring. This includes data that changes over time, such as IoT sensor readings and application performance logs. InfluxDB is a popular, open-source, time-series data store that can handle large volumes of time-stamped data. It is lightweight, fast, and seamlessly integrates with tools such as Grafana, Telegraf, and Prometheus to monitor and visualize data.
This tutorial will show you how to install InfluxDB and configure it on a Ubuntu 24.04 Virtual Private Server. You can then start collecting time-series data and analyzing it in just minutes.
What Is InfluxDB?
InfluxDB, an open-source database for time series data developed by InfluxData, is a free and open-source product. It is optimized for high write throughput, real-time analytics, and data storage policies. It is designed to handle time-stamped information efficiently and at a large scale, unlike traditional databases.
Key Features:
- High performance: Handles millions per second.
- Time-based queries are ideal for metrics, logs, and IoT data.
- Retention policies: automatically expire old data in order to save space.
- HTTP API support: Allows for easy integration with monitoring software.
- Compatible with Grafana for powerful visual dashboards
How to Install InfluxDB on Ubuntu 24.04 VPS for Time-Series Data
Installing InfluxDB on a Ubuntu 24.04 Virtual Private Server provides a reliable and scalable solution to manage time-series data. InfluxDB provides the flexibility and performance you need to store and analyze your data, whether you are monitoring system metrics, sensors from IoT, or application logs.
Step 1: Add the InfluxData Repository
InfluxDB doesn't appear in Ubuntu's default repository, so you'll need to add InfluxData's official repository.
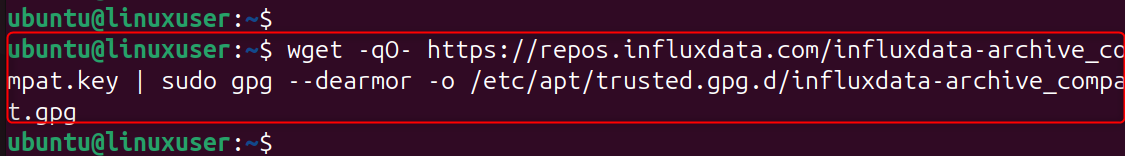
Import the GPG key from the InfluxData package repository.
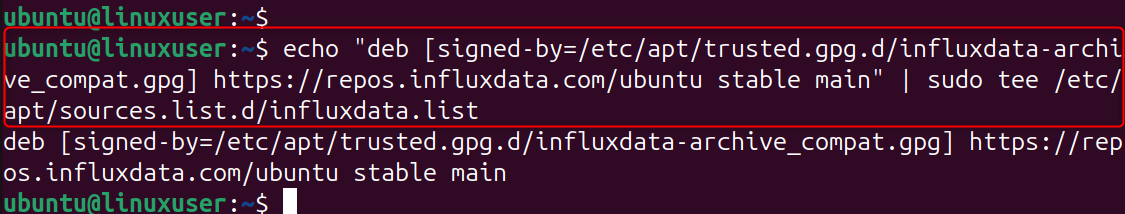
Add the repository to your sources list.
Update package lists:
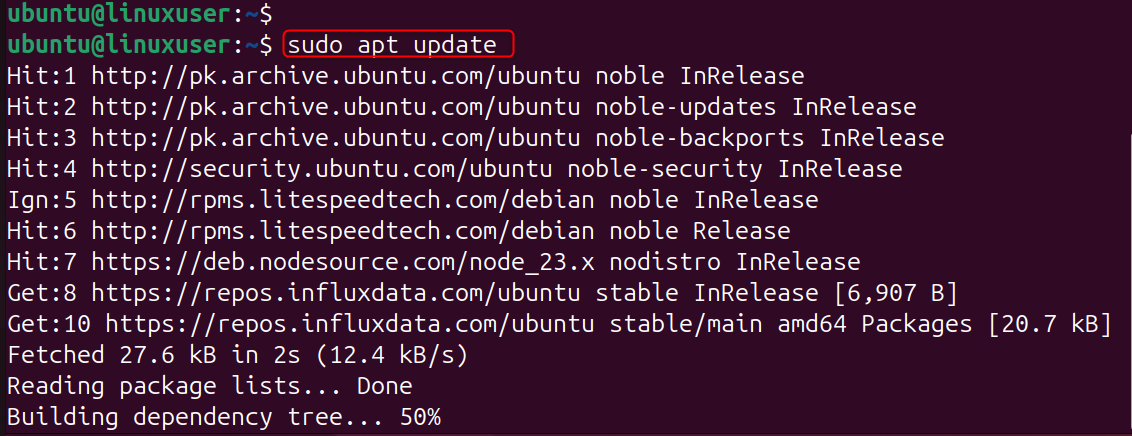
This ensures that you can install the most recent stable version of InfluxDB from the official repository maintained by InfluxData.
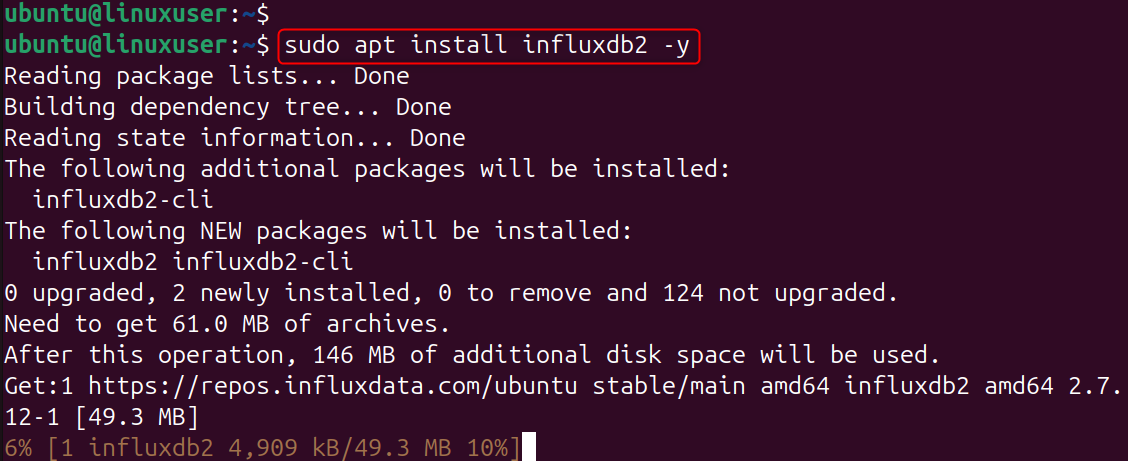
Step 2: Install InfluxDB
Now, install InfluxDB using the command below. This will install and launch InfluxDB in the background, so that it is launched automatically at system startup:
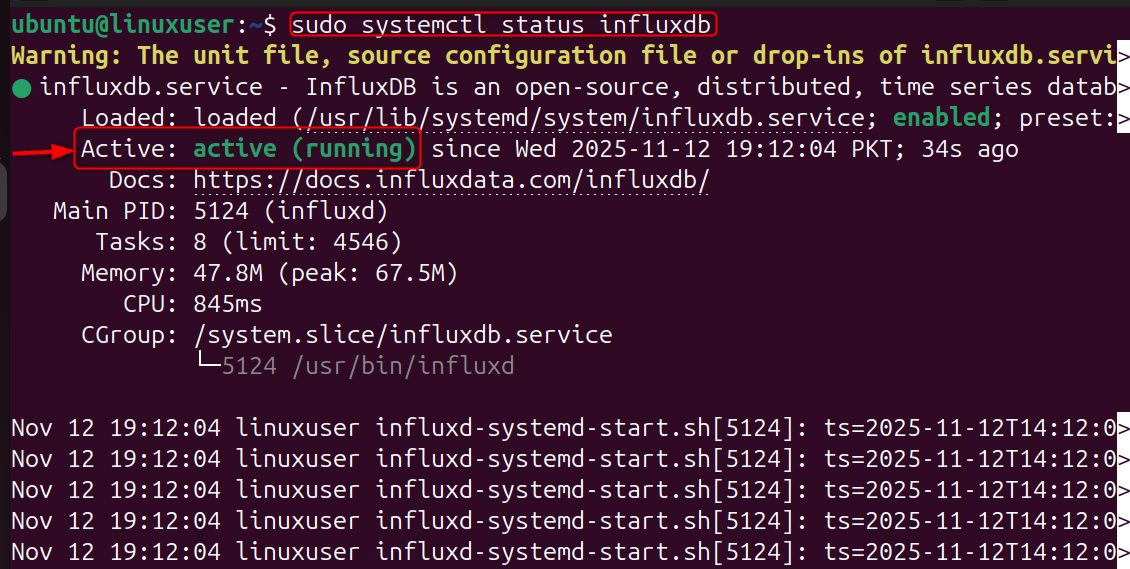
Enable and start the service:

Verify that InfluxDB is running:
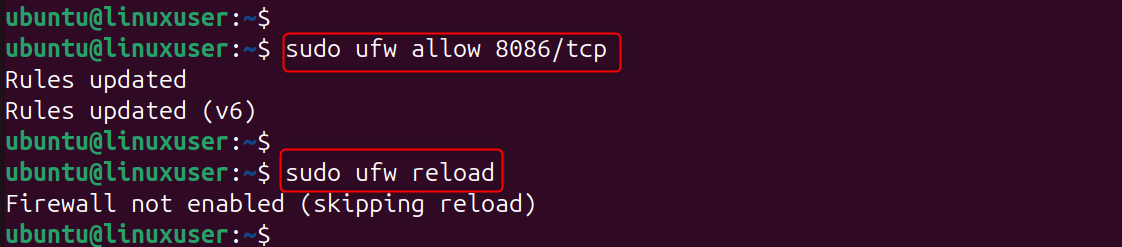
Step 3: Configure Firewall
Open port 8086 to allow external access to InfluxDB API and web interface. Port 8086 can be used to connect to both InfluxDB HTTP and the web interface.
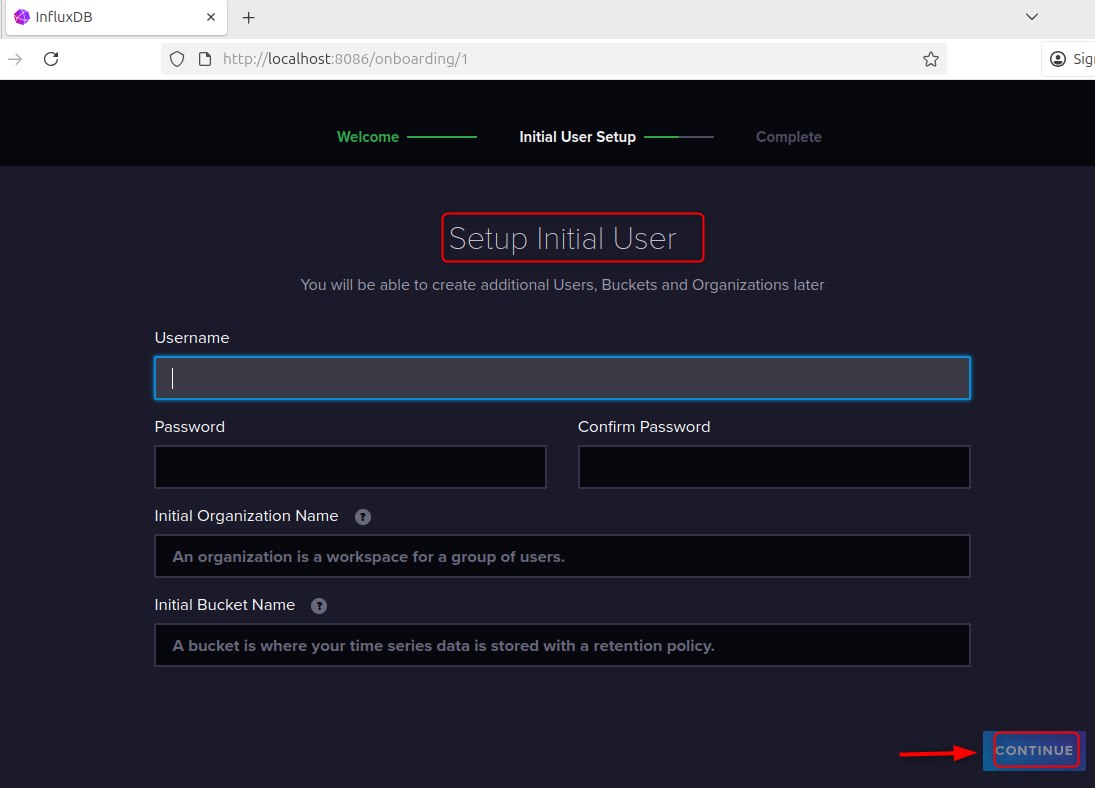
Step 4: Access the InfluxDB Web Interface
Open your browser and go to:
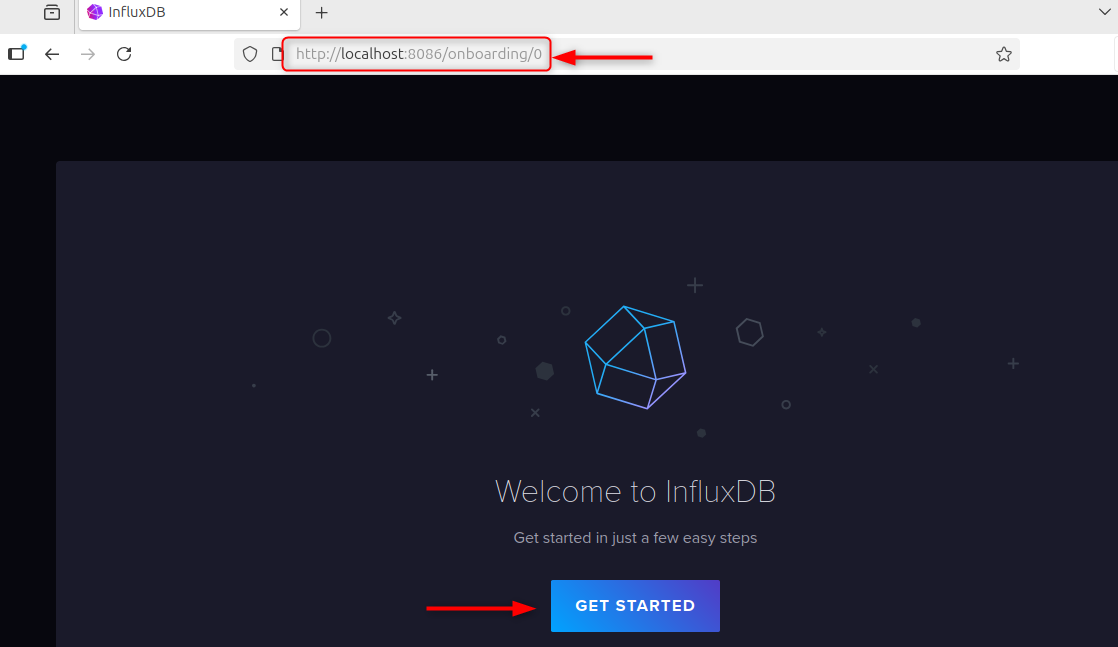
The InfluxDB wizard will appear. Follow these steps:
- Create a username/password.
- Name your organization
- Create a bucket.
InfluxDB generates an authentication token that you can use to access APIs and integrate with other systems.
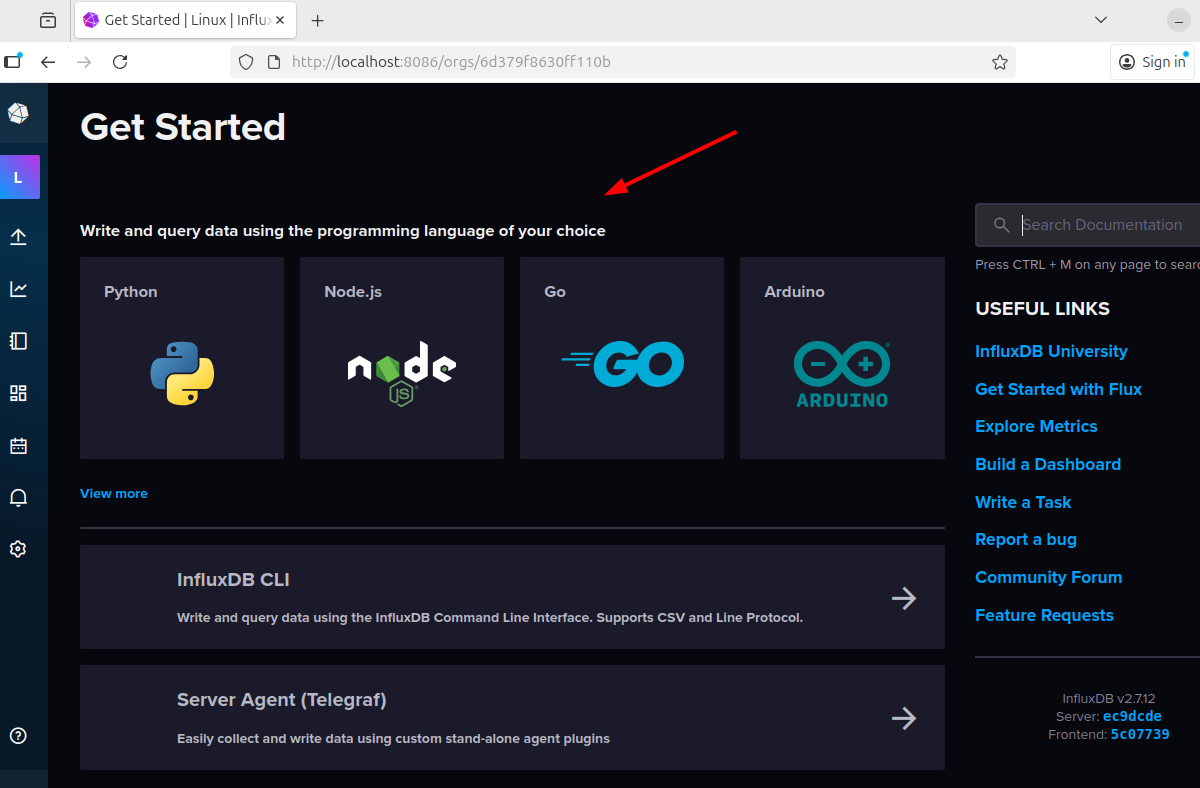
Web UI allows you to easily create users, manage organisations, and view metrics using a graphical interface.
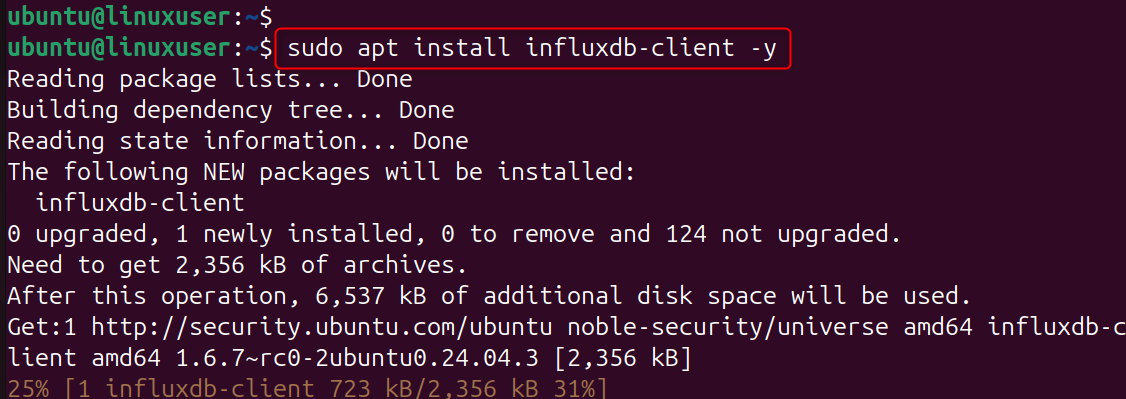
Step 5: Using the Influx CLI
InfluxDB is a command-line tool that allows you to manage databases and queries. Install the CLI Tool (if it is not installed automatically).
Then log in using your credentials:
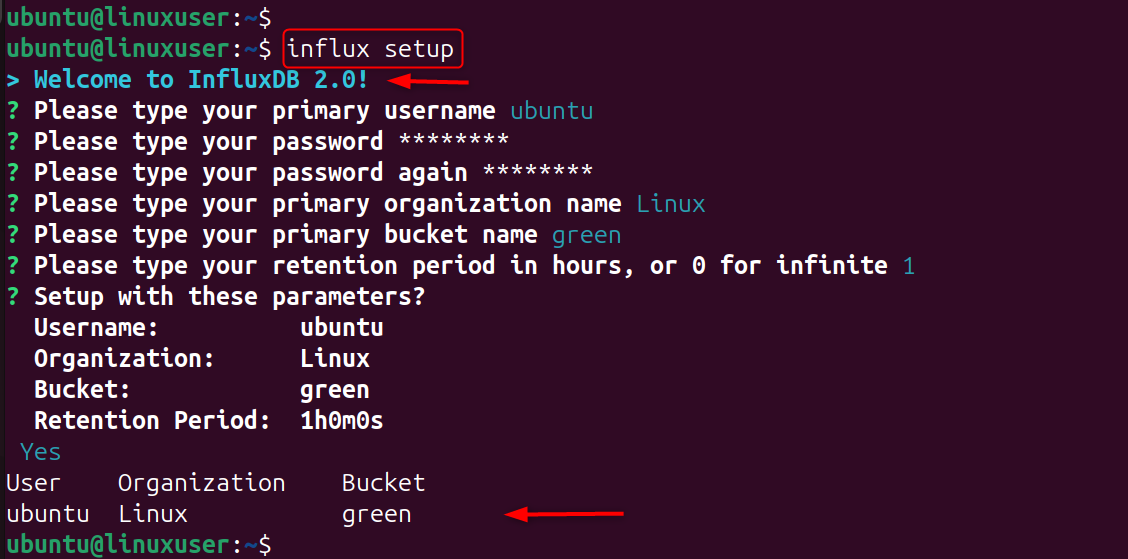
You will be asked to enter your username and password. Also, you'll need to provide details about your organization.
To check your connection:

Influx's CLI lets you interact with your database from the terminal, for automation and scripting.
Step 6: Configure InfluxDB for Remote Access
You can edit the configuration file to make InfluxDB available from other applications (like Grafana and Telegraf).
Open the file:
Make sure it is set to Listen on all network interfaces.
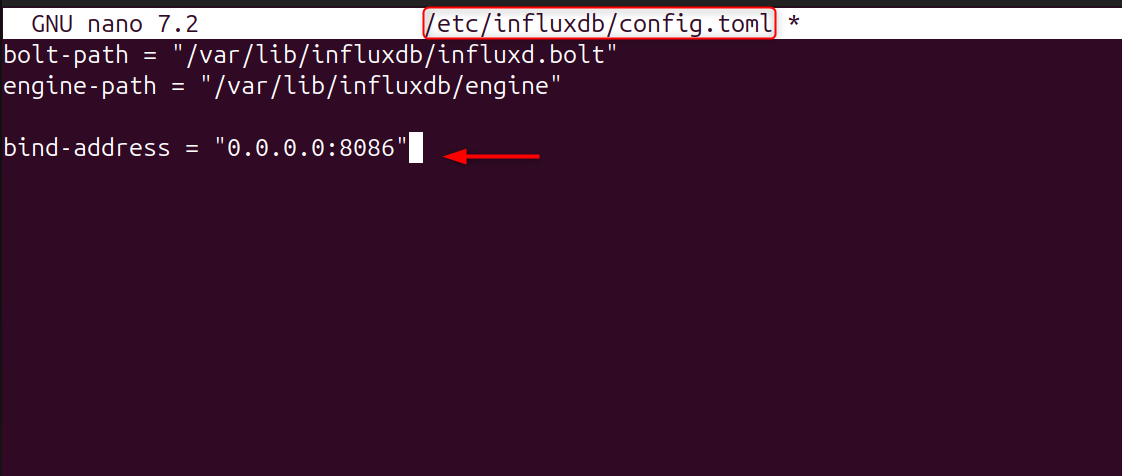
Save and exit, then restart the service:

InfluxDB can accept connections from remote clients. This is useful if you use multiple servers to monitor and visualize data.
Step 7: Verify Installation
Run the following to confirm that InfluxDB works correctly:

You have successfully installed your software!
You can also check logs for errors:
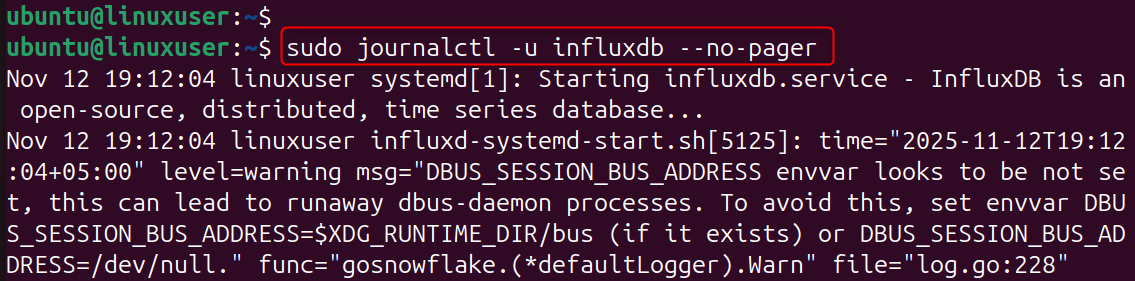
InfluxDB is running smoothly and without any issues.
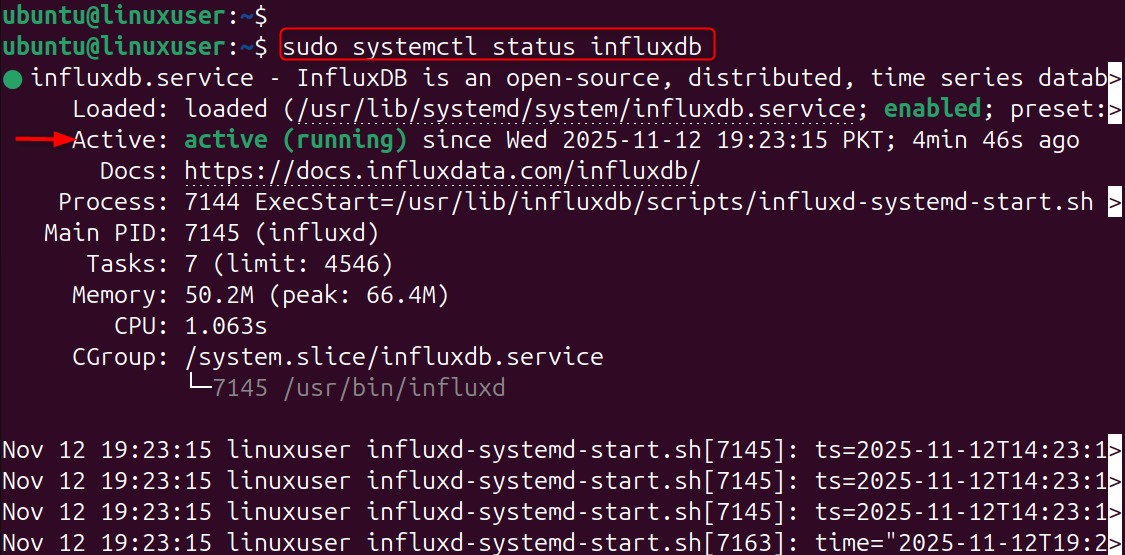
Step 8: Manage InfluxDB Service
These commands allow you to easily control the InfluxDB Service during maintenance or configuration changes. Common systemd commands to manage InfluxDB
Follow the steps in the guide to add the repository, install the package, set up users and integrate with visualization tools.
You'll be able to run a powerful database of time series in just minutes. You can pair it with Grafana to create beautiful dashboards and have a complete monitoring system.
Conclusion
To install InfluxDB on Ubuntu 24.04 VPS, start by updating your system with sudo apt update, then add the InfluxData repository using wget -qO- https://repos.influxdata.com/influxdata-archive_compat.key | sudo gpg --dearmor -o /etc/apt/trusted.gpg.d/influxdata-archive_compat.gpg and add it to sources with echo "deb [signed-by=/etc/apt/trusted.gpg.d/influxdata-archive_compat.gpg] https://repos.influxdata.com/ubuntu stable main" | sudo tee /etc/apt/sources.list.d/influxdata.list.
Install InfluxDB with sudo apt-get install influxdb2 --y. Then enable the service using sudo systemctl influxdb enable --now. Use sudo ufw 8086/tcp to allow access through your firewall. Accessing the web interface by visiting http:// :8086 will create a bucket, user, and organization. Verify the setup using influx ping.
Want to deploy InfluxDB in your enterprise? Consider using our Cheap VPS solution for your project.
