What is Elastic?
Often referred to as ELK, Elastic Stack, or Elastic Search /on one of its components/ it is a set of three open-source software products.: Elasticsearch, Logstash, and Kibana. This combination is actually a very powerful toolset used for collecting, processing, storing, searching, analyzing, and visualizing large volumes of data.
- ElasticSearch: Elasticsearch is a search and analytics engine. It's the core component of the ELK Stack that stores and indexes data, making it easy to search, retrieve, and analyze.
- Logstash: Logstash is a data processing and ingestion tool. It's responsible for collecting and processing data from various sources, transforming it into a common format, and sending it to Elasticsearch for indexing.
- Kibana: Kibana is a data visualization and dashboarding tool that works with Elasticsearch. Kibana's user-friendly interface enables users to explore and analyze data visually.
- Beats: Beats are lightweight data shippers, which collect, ship, and process data from various sources. They are designed to gather different types of data and send it to Elasticsearch or Logstash for further processing. Beats are often used to enhance data collection capabilities.
In this tutorial, we are going to show you how to install and pair all stack components. We are going to use an Ubuntu 22.04 VPS with a created sudo user.
Installing Elastic Search
The ELK stack components are not available by default in Ubuntu’s apt repositories. We will need to add Elastic's package source list manually.
We can do this by running:
curl -fsSL https://artifacts.elastic.co/GPG-KEY-elasticsearch |sudo gpg --dearmor -o /usr/share/keyrings/elastic.gpg
echo "deb [signed-by=/usr/share/keyrings/elastic.gpg] https://artifacts.elastic.co/packages/7.x/apt stable main" | sudo tee -a /etc/apt/sources.list.d/elastic-7.x.list
Update your package list and install Elastic Search.
sudo apt update
sudo apt install elasticsearch
Now we will need to apply some modifications to the Elastic Search configuration file. It's an YAML file, located in /etc/elasticsearch/.
Open the file with your preferred text editor. In our case, we will use nano.
sudo nano /etc/elasticsearch/elasticsearch.ymlThe YAML syntax strongly relies on indentations, so we need to be cautious when modifying the file. Make sure that you maintain the same indentation format.
Elastic Search listens for traffic from everywhere on port 9220. Leaving it so can be a severe security issue. We will need to modify this in the configuration file.
Find the network.host line in the file, uncomment it, and update its value to localhost. It should look like this.
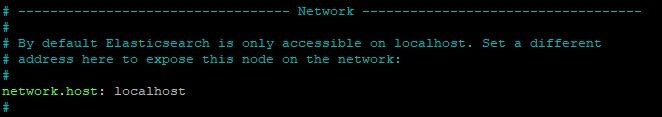
Elastic Search will now listen on all interfaces and bound IPs. If you want it to listen to a specific IP /if you have multiple assigned/, you can replace localhost with it.
Now we can start, enable, and test Elastic Search by running:
sudo systemctl start elasticsearch
sudo systemctl enable elasticsearch
curl -X GET "localhost:9200"
If everything is fine with your installation, curl will response with a similar output:
{
  "name" : "alpha-vps-elastic",
  "cluster_name" : "elasticsearch",
  "cluster_uuid" : "eIJ2JbTHTSKRw8vJlL6Ewg",
  "version" : {
    "number" : "7.17.12",
    "build_flavor" : "default",
    "build_type" : "deb",
    "build_hash" : "e3b0c3d3c5c130e1dc6d567d6baef1c73eeb2059",
    "build_date" : "2023-07-20T05:33:33.690180787Z",
    "build_snapshot" : false,
    "lucene_version" : "8.11.1",
    "minimum_wire_compatibility_version" : "6.8.0",
    "minimum_index_compatibility_version" : "6.0.0-beta1"
  },
  "tagline" : "You Know, for Search"
}
Installing Kibana
You can install Kibana by running:
sudo apt install kibanaEnable and start it with:
sudo systemctl enable kibana
sudo systemctl start kibana
Setting up Nginx and serving Kibana
Kibana is configured to only listen on localhost. To allow external access to it, we must set up a reverse proxy. For this purpose, we will use Nginx, which is a very popular web server.
Nginx can be installed on our server by running:
sudo apt install nginxWe will need to create a Kibana user which you’ll use to access the Kibana web interface. We can do this with the openssl CLI tool. You will need to specify your own username.
echo "username-here:`openssl passwd -apr1`" | sudo tee -a /etc/nginx/htpasswd.usersProvide and confirm your secure password.
Create a Nginx server block and specify your domain name:
sudo nano /etc/nginx/sites-available/domain-name-here
Add the following content to your server block file. Make sure that you specify your domain name here as well.
server {
    listen 80;

    server_name domain-name-here;

    auth_basic "Restricted Access";
    auth_basic_user_file /etc/nginx/htpasswd.users;

    location / {
        proxy_pass http://localhost:5601;
        proxy_http_version 1.1;
        proxy_set_header Upgrade $http_upgrade;
        proxy_set_header Connection 'upgrade';
        proxy_set_header Host $host;
        proxy_cache_bypass $http_upgrade;
    }
}
Enable the new configuration file by running:
sudo ln -s /etc/nginx/sites-available/domain-name-here /etc/nginx/sites-enabled/domain-name-hereTest your configuration file and reload Nginx.
sudo nginx -t
sudo systemctl reload nginx
You will receive a syntax is ok output if everything is fine.
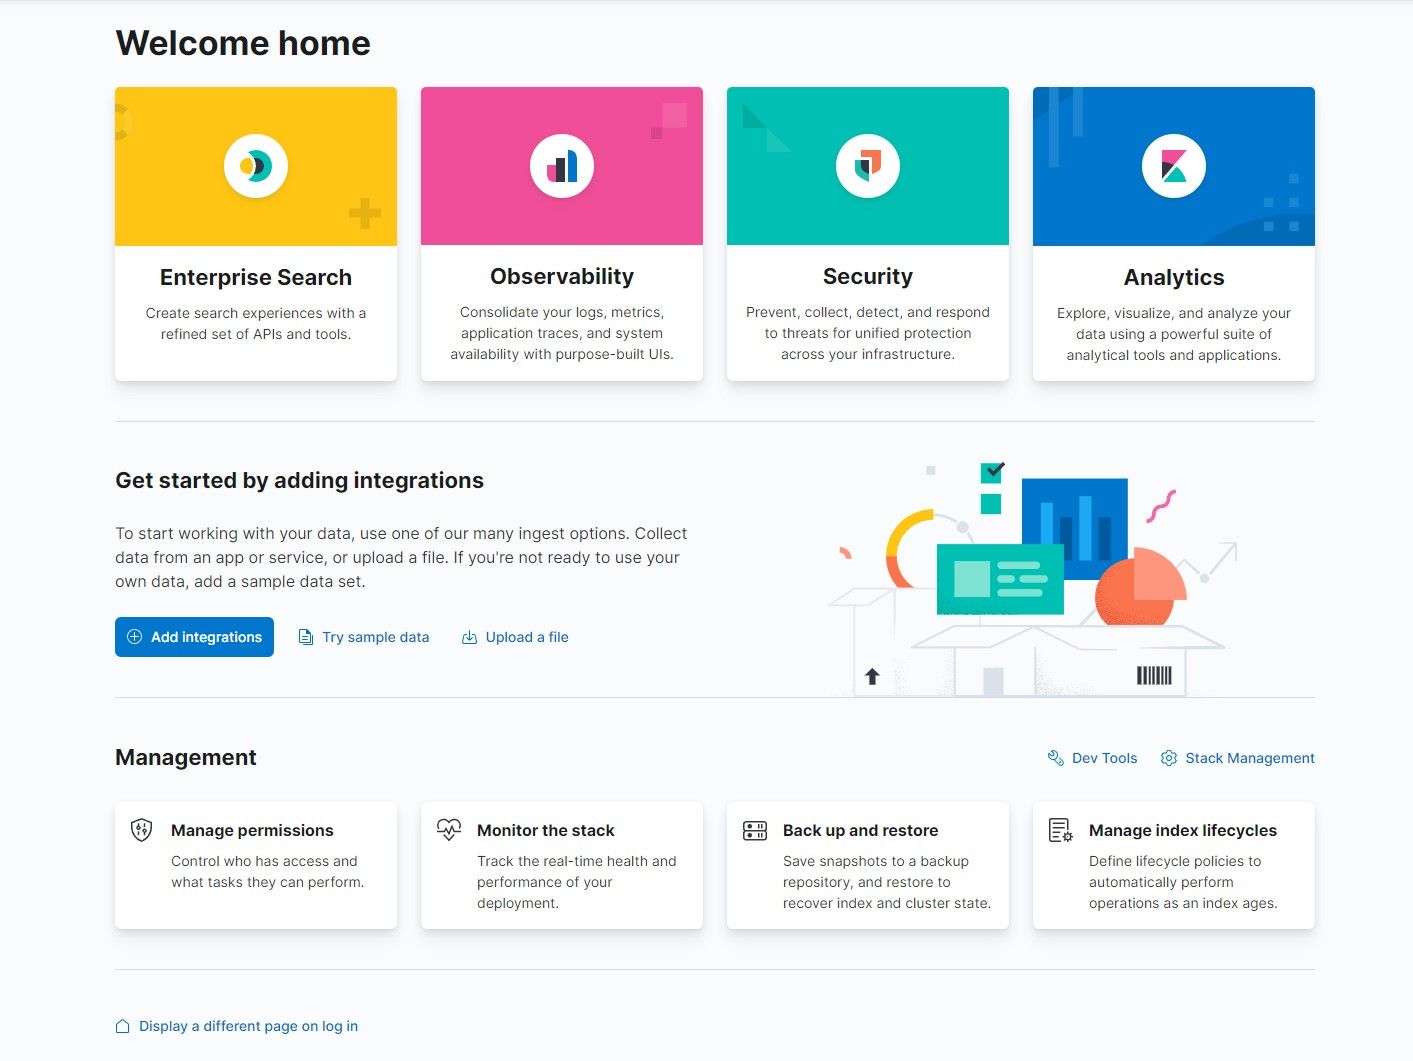
ufw allow 'Nginx Full' command.You can now navigate to Kibana's web GUI in your browser.
Navigate to http://domain-name-here or http://ip-address-here
sudo rm /etc/nginx/sites-avalable/default and sudo rm /etc/nginx/sites-enabled/default.Provide your username and password and sign in.
Installing Logstash
Logstash is the data processing component of the Elastic Stack. It is a pipeline that processes and sends information to Elastic Search. It has two required components - input and output. input ingests data from a source while the output sends the data. A filter is an optional Logstash component, which acts as "middleware" between the input and output. The filter processes the data.
Install Logstash with this command:
sudo apt install logstashLogstash's configuration files reside in /etc/logstash/conf.d
We can create a new input configuration file by running:
sudo nano /etc/logstash/conf.d/02-beats-input.confand insert the following configuration in it:
input {
  beats {
    port => 5044
  }
}
Now, let us create a configuration file for our output component.
sudo nano /etc/logstash/conf.d/30-elasticsearch-output.confoutput {
if [@metadata][pipeline] {
elasticsearch {
hosts => ["localhost:9200"]
manage_template => false
index => "%{[@metadata][beat]}-%{[@metadata][version]}-%{+YYYY.MM.dd}"
pipeline => "%{[@metadata][pipeline]}"
}
} else {
elasticsearch {
hosts => ["localhost:9200"]
manage_template => false
index => "%{[@metadata][beat]}-%{[@metadata][version]}-%{+YYYY.MM.dd}"
}
}
}The output configuration tells Logstash to send the Beats data in Elastic Search.
Once this is done, you can test your configuration by running:
sudo -u logstash /usr/share/logstash/bin/logstash --path.settings /etc/logstash -tStart and enable Logstash by running:
sudo systemctl start logstash
sudo systemctl enable logstash
Installing a Beat
Beats are lightweight data shippers who collect data from different sources and transport them to either Logstash or Elasticsearch directly.
The Beats platform currently includes 6 different data shippers for different kinds of data:
- Filebeat: Lightweight shipper for logs and other data
- Metricbeat: Lightweight shipper for metric data
- Packetbeat: Lightweight shipper for network data
- Winlogbeat: Lightweight shipper for Windows event logs
- Auditbeat: Lightweight shipper for audit data
- Heartbeat: Lightweight shipper for uptime monitoring
For this tutorial, we are going to proceed Filebeat, which will send local logs to Logstash. We can install it by running:
sudo apt install filebeat
Let's configure Filebeat to connect to Logstash. We can access its configuration file with:
sudo nano /etc/filebeat/filebeat.ymlNotice that this is a YAML file again. Be careful with the format and indentations.
Filebeat supports multiple outputs at the same time. In our case, we will send our output to Logstash, but by default, Filebeat's configuration includes an output directly to Elastic Search. We will need to disable it by modifying the configuration.
Find the output.elasticsearch line and comment it as shown in the image below.
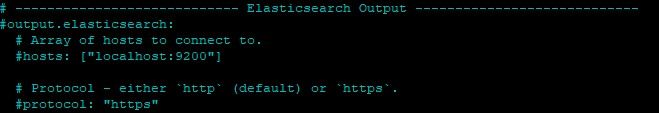
To configure the output to Logstash, find the output.logstash line and uncomment the lines as shown below:
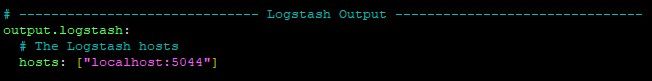
Save and close the file.
Configuring Filebeat
Filebeat can be extended with Filebeat modules. These modules are a collection of tools for ingesting, storing, searching, and visualizing data. They are pre-configured sets of input configurations, parsers, and dashboards that make it easier to process different types of log and event data. Each module is tailored for a particular type of data source, such as system logs, application logs, security logs, and more.
You can enable Filebeat modules by running:
sudo filebeat modules enable systemYou can list the modules by running:
sudo filebeat modules listYou will receive a similar output:
Enabled:
system

Disabled:
activemq
apache
auditd
aws
awsfargate
azure
barracuda
bluecoat
cef
checkpoint
cisco
coredns
crowdstrike
cyberark
cyberarkpas
cylance
elasticsearch
envoyproxy
f5
fortinet
gcp
google_workspace
googlecloud
gsuite
haproxy
ibmmq
icinga
iis
imperva
infoblox
We will use the system module, which collects and parses logs created by your Ubuntu system.
When you enable a Filebeat module, it automatically configures the necessary inputs, filters, and outputs for a particular type of log or event data. It can also include pre-built dashboards in Kibana.
Now we will need to load the ingest pipeline for the system module. We can do this by entering:
sudo filebeat setup --pipelines --modules systemOnce this is done, we will need to load the so-called index template into Elastic Search.
Index templates are automatically applied when a new index is created.
We can load the template by running:
sudo filebeat setup --index-management -E output.logstash.enabled=false -E 'output.elasticsearch.hosts=["localhost:9200"]'To load the pre-built Kibana dashboards and visualize Filebeat data, we will need to run:
sudo filebeat setup -E output.logstash.enabled=false -E output.elasticsearch.hosts=['localhost:9200'] -E setup.kibana.host=localhost:5601After these configuration steps are done, we can start and enable Filebeat with the following commands:
sudo systemctl start filebeat
sudo systemctl enable filebeat
Now, all of our ELK stack components are successfully installed and configured.