
Running a VPS gives you the freedom of control, but it also adds to your accountability regarding performance issues. One of the most common performance issues you can encounter is if a single process at some point in time has consumed too many CPU cycles. A high-CPU process can negatively affect your applications, cause slow response times or services to crash altogether.
In particular, consistent spikes can sometimes result in constant resource consumption and an unexpected billing situation. Being able to effectively find and kill any high CPU processes on a VPS quickly will help keep your server functioning normally.
Identifying high-CPU processes in either a VPS, live production instance, or in a small personal server has a few distinct commands and steps that are very basic in nature. This document is useful, as it describe simple steps that anyone that doesn't have intense backgrounds in server management can follow with open access to a terminal command line interface through an SSH connection for a few initial steps.
In this guide, you will learn how to identify CPU-consuming processes, and what goes into determining whether that process should be terminated or stopped. You will also learn how to ensure that the process is safely terminated. We will also discuss methods of preventing the same situation from occurring again, as well as some basic monitoring tools.
Prerequisites
This guide applies to Debian- and Ubuntu-based VPS environments.
Before you begin, make sure you have:
- A VPS with SSH access and sudo privileges.
- Basic familiarity with running commands in the terminal.
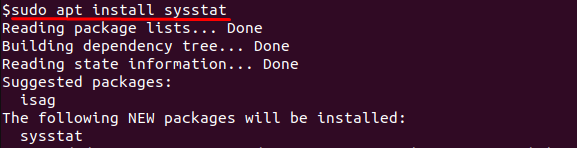
- The following packages installed:
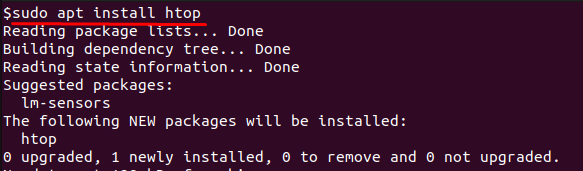
sudo apt updatey htop sysstat psmisc
sudo apt install -
Note:sysstatprovides tools likepidstat,sar, andiostat.psmiscincludeskillall, which is used later in this guide.
Immediate Checks for Your VPS
When your VPS feels unresponsive, you don’t always need advanced tools right away. A few quick checks can help you confirm whether the issue is temporary or if deeper investigation is required.
Check overall system load
The uptime command gives a quick overview of how long the system has been running along with the current load averages:

If the load average is consistently higher than the number of CPU cores, your server is under significant stress.
Check memory pressure
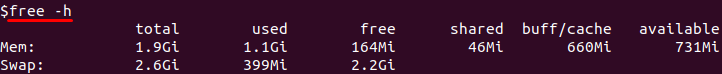
High CPU usage is sometimes a side effect of memory shortages. The free command shows available RAM and swap usage in a human-readable format:
If free memory is very low or swap usage is high, processes may be competing for resources, making CPU usage appear higher.
Get a quick CPU/IO snapshot
The vmstat command provides a compact summary of CPU, memory, and I/O activity over short intervals.
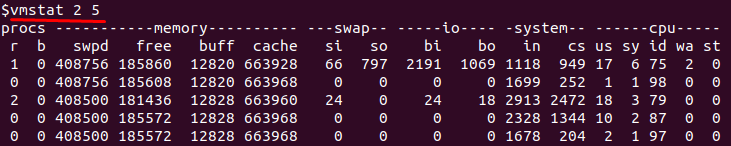
This prints statistics every 2 seconds for 5 runs. Pay close attention to the wa (I/O wait) column; high values mean the CPU is often stalled while waiting on disk operations.
How to Quickly Detect High-CPU Processes
When a VPS slows down due to CPU spikes, the first step is to identify which processes are consuming resources. Linux provides several tools for this purpose, ranging from interactive monitors to static snapshots and historical analysis.
Using top
The top command is the default monitoring tool available on almost every Linux distribution. It provides a real-time, continuously updated list of processes with details like CPU usage, memory consumption, and process IDs. This makes it the fastest way to see which tasks are consuming resources at any moment:
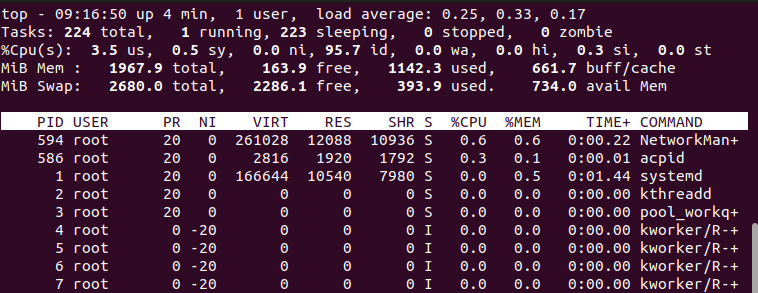
When you run top, the %CPU column shows how much CPU each process is consuming. You can sort interactively with Shift + P for CPU or Shift + M for memory, and press k to kill a process by entering its PID.
If you prefer a one-time snapshot instead of the live interface, you can limit the view to processes owned by a specific user, such as root:
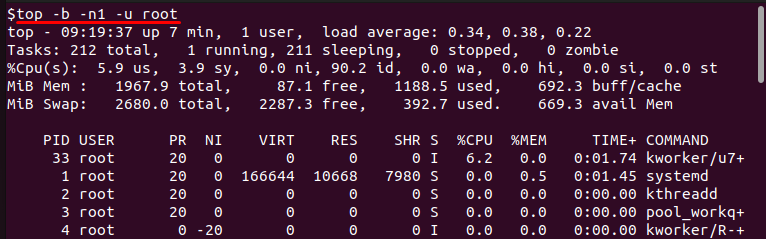
Here, the -b flag runs top in batch mode, -n1 captures only one iteration, and -u root filters the output to display only processes started by the root user. This is useful for quickly checking whether system-level tasks are causing high CPU load.
Using htop
htop is an improved version of top that offers a more user-friendly interface with color-coded bars and interactive controls. Unlike top, it is not preinstalled and needs to be added manually.
Once installed, launch it with:
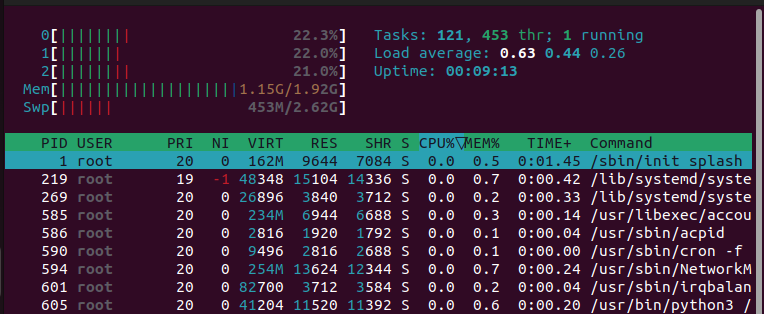
The top section of htop displays CPU usage across all cores, while the lower section lists processes. Press P to sort by CPU, M to sort by memory, and F6 to customize sorting further.
You can search for a process with F3, filter by user with u, and terminate a process by selecting it and pressing F9. Compared to top, htop provides an easier way to interactively manage resource-hungry processes.
Using ps
The ps command provides a static snapshot of processes at the moment you run it. It is especially useful when you need precise reports or when saving command output for documentation:
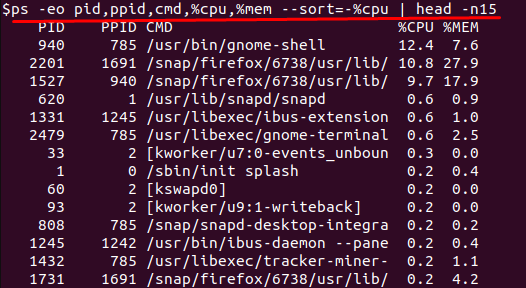
This command shows the top fifteen CPU consumers along with their PID, parent PID, user, command, CPU, and memory usage. The --sort=-%cpu option sorts processes in descending order of CPU usage.
You can also filter processes by a specific user. For example, to see processes owned by root:
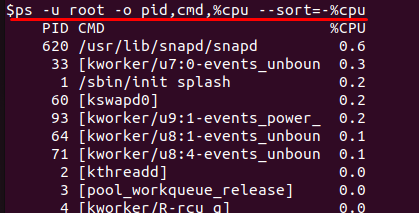
This makes ps particularly effective when you want to isolate workloads owned by one account, such as an application user.
Using pidstat
pidstat is part of the sysstat package, which provides advanced performance monitoring tools. Since it is not available by default, you need to install it first.
After installation, run:
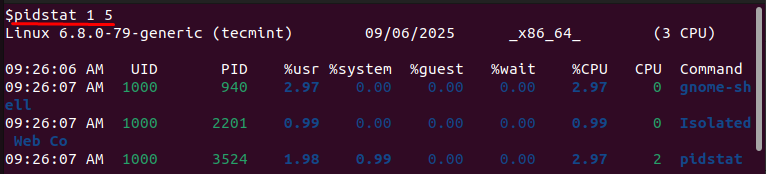
This shows CPU usage for each process every second, repeated five times. Unlike top or ps, pidstat highlights how processes behave over time, making it easier to spot tasks that repeatedly spike CPU usage.
Using sar
sar, also included in sysstat, can collect and report both real-time and historical system activity. This is valuable when you want to see trends rather than just current values.
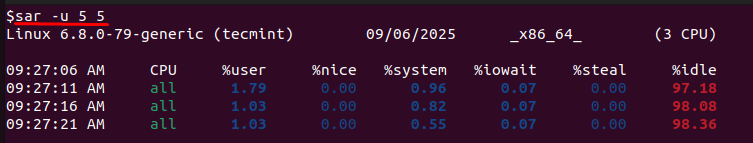
The -u flag requests CPU utilization statistics, and 5 5 means readings are taken every five seconds for five intervals. The output breaks CPU time into user, system, idle, and I/O wait percentages, helping you determine whether high usage is caused by applications or by system-level overhead.
Using iostat
iostat, another tool in the sysstat package, focuses on CPU and I/O performance. It is especially useful when high CPU usage is linked to disk bottlenecks.
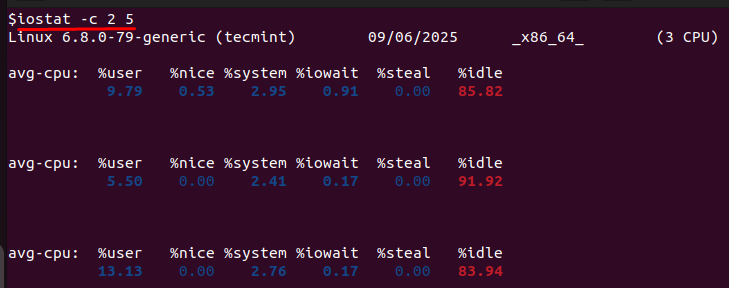
The -c flag restricts output to CPU statistics only, and 2 5 specifies updates every two seconds for five iterations. In the output, pay close attention to the %iowait column. If this value is high, it means the CPU is mostly idle but waiting on disk operations, which can mimic high CPU usage.
Safely Kill High CPU Processes on VPS
Once you identify a high-CPU process using the earlier commands (top, htop, or ps), the next step is to terminate it. Every process is assigned a PID (Process ID), which appears in the output of those tools. With the PID in hand, you can safely quit or kill the process using the following methods.
Using kill with PID
The kill command is the most direct way to stop a process. It works by sending a signal to the process ID (PID).
The -15 option sends a SIGTERM (terminate) signal. This politely asks the process to exit, giving it a chance to close files and free resources. It is always best to try SIGTERM first because it prevents data corruption.
If the process does not respond to SIGTERM, you can use the stronger SIGKILL signal:
The -9 option forces the process to stop immediately. While effective, it does not allow cleanup, which may leave temporary files or incomplete writes. Use SIGKILL only as a last resort.
Using pkill by Process Name
Instead of manually looking up PIDs, you can terminate processes by name with pkill.
This sends a SIGTERM to all processes matching the name nginx. Replace nginx with the name of the service or application you want to stop. Like kill, you can also use -9 if SIGTERM fails, but always try -15 first.
Using killall for Multiple Instances
Another option is killall, which stops all processes with a given name.
This example sends a SIGTERM to all apache2 processes. If several instances of the same program are running and causing high CPU usage, killall makes it quick to shut them down at once.
Safety Notes Before Killing a Process
Never kill PID 1 — it is the init/systemd process, and stopping it will crash your entire VPS.
Be careful with databases (e.g., mysqld, postgres) — killing them abruptly can lead to data loss or corruption.
If a process is a system service, it is safer to restart it with:
This ensures the service restarts cleanly instead of crashing midway.
Reliable CPU performance starts with strong infrastructure.
At AlphaVPS, our High-Performance VPS and Ryzen VPS plans provide consistent compute power for workloads you monitor with tools like top, htop, and pidstat.
If you need more storage for logs or backups, our Storage VPS offers dependable performance for heavier I/O tasks.
Conclusion
Running a VPS gives you control over its performance, and high-CPU processes are one of the most difficult parts of managing any server. In this guide, we've explored many ways to find resource-heavy tasks using; "top", "htop", "ps", and various sysstat utilities (pidstat, sar, and iostat, to name a few).
Once you discover the process causing the spike, it's equally important to safely stop it. The kill, pkill, and killall commands provide the muscle, while caution reminds you to avoid stopping system services essential for the process of healthy computing. Your best effort will lead to more proactive monitoring to stabilize, prevent downtime, and keep your VPS running smoothly.
