
Operating a VPS means any and all network performance impacts the way your applications and websites behave. Just a split second of delay in transmitting data may result in slow page loads, service interruptions, and user dissatisfaction. A spike in traffic or undesirable bandwidth use puts the VPS in a situation where performance can degrade, and it may even go down altogether.
Typical scenarios such as high bandwidth usage, changes in server response times, or unusual incoming requests could be a sign of congestion on the network, bad configuration, or a combination of a DDoS attack and network congestion. Knowing the issue exists before it causes service downtime, or worse, higher costs because of bandwidth overage, can give an administrator some peace of mind.
Tools like bmon and iftop have made it incredibly easy to monitor network performance usage in real-time. They summarize bandwidth and connection usage quickly and simply in a terminal. Using both of these tools together give VPS users a clearer picture of all that is happening on the network; this can help with troubleshooting and managing more efficiently.
Why Network Monitoring Matters for VPS
A VPS has many services running concurrently, all of which rely upon consistent network performance. Applications experience reliability issues when packet loss occurs or latency rises. Network monitoring gives insight into the amount of data that goes in and out, so you can identify irregular behavior before it escalates into a major problem.
Traffic increases are sometimes a healthy and honest sign of growth, and sometimes they could be disastrous events (such as port scans, or even brute-force attempts). Monitoring enables a quick verification of the traffic's intent so you can take corrective action (block IPs, re-tune firewall rules, etc.).
Network monitoring can even lend helpful information for resource allocation. If you can determine which services are using the most bandwidth, then you may be able to load balance workloads, increase server limits, or simply reduce unnecessary bandwidth consumption. Overall network monitoring extends towards the overall stability of your VPS platform and allows more consistent performance during times of peak demand.
For best results, network monitoring should be paired with a stable and responsive hosting environment. At AlphaVPS, our high-performance VPS plans feature low-latency networking, redundant uplinks, and optimized routing for consistent throughput across Europe and beyond. Whether you’re troubleshooting with iftop or graphing interface statistics through bmon, you can rely on a fast and predictable network backbone designed for professionals.
Overview of bmon and iftop
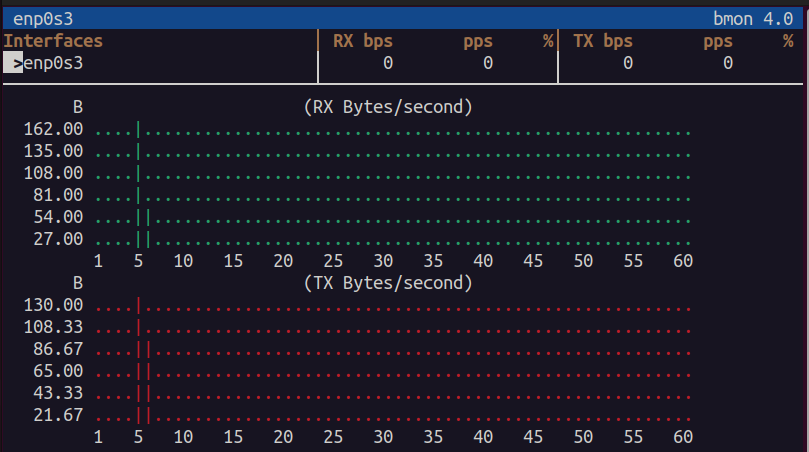
bmon (Bandwidth Monitor) is a simple tool for Linux that presents network traffic on a per interface basis in real time. It indicates both incoming and outgoing data rates through a basic text based dashboard with an easy interface to switch between the interfaces and view current, average and peak usage of each interface with only light resource usage.
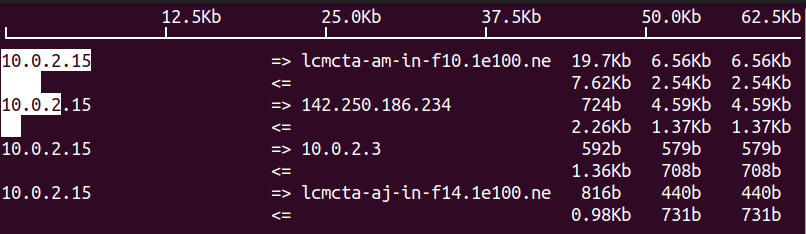
iftop is similar to a "top" command, but for network connections. It lists the active connections along with their source and destination IP addresses, as well as the amount of bandwidth each connection is using (in real time). This provides useful information for identifying the host or service consuming the most data.
When used together, these two tools give a complete picture of the health of your network. Easily determine the overall usage of the interfaces with bmon, and have more granular information on a per connection basis with iftop. If you are a VPS user, you will be able to quickly determine overall health and usage without installing an dedicated monitoring tools to examine the activity of your network.
Installing bmon and iftop on Linux VPS
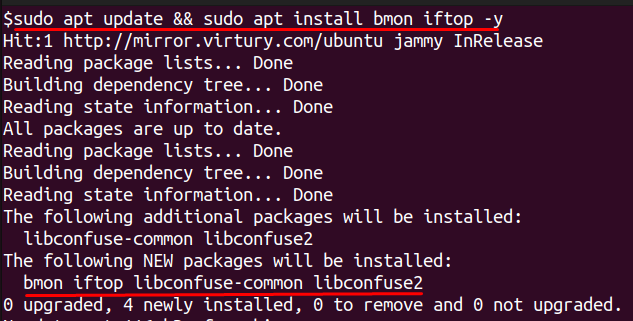
Installing bmon and iftop takes only a few commands and works on most Linux distributions. On Ubuntu or Debian, run:
For CentOS, AlmaLinux, or RHEL, use:
On Arch Linux or Manjaro, run:
After installation, confirm they are available by typing bmon -v and iftop -h. Run both tools with root or sudo so they can read network interfaces completely. Keeping them up to date through your package manager ensures you always get the latest features and security fixes.
Analyzing Network Performance on VPS with bmon
bmon offers multiple options to customize how network data is displayed and recorded. Using these flags correctly helps you focus on the exact information you need.
Specifying an Interface with -p
The -p flag allows you to monitor only one interface instead of every device on the system. For example:
This command filters output to the eth0 interface and removes unrelated devices, which is helpful if you are troubleshooting a single connection or want a cleaner display.
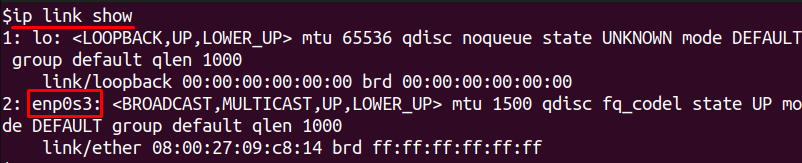
If you don’t know your network interface name then you can find it by executing:
Choosing Output Format with -o
The -o flag controls how bmon outputs data. By default, it shows a real-time interactive view. You can switch to ASCII output or even export structured data. For example:
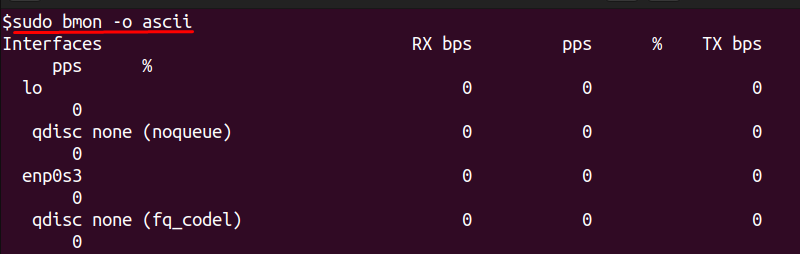
This command prints a one-time snapshot and exits, which is useful for logging results in scripts. For integration with monitoring systems, JSON output can be selected using -o json.
Setting Refresh Rate with -r
The -r flag allows you to control how frequently bmon updates the display. A lower refresh rate means faster updates but slightly more CPU usage, while a higher value reduces load on busy servers.
To refresh every second, run:

This creates a very responsive, near real-time display of network activity. If you want slower updates, increase the number (for example, -r 5 refreshes every five seconds).
Analyzing Network Performance on VPS with iftop
iftop provides a live, top-like view of network traffic, showing which connections are consuming bandwidth. Its options and interactive keys let you filter, sort, and interpret traffic efficiently.
Specifying an Interface with -i
Run iftop with the -i flag to monitor a specific network interface:
This focuses only on eth0 and ignores other interfaces, which keeps the output clear and relevant.
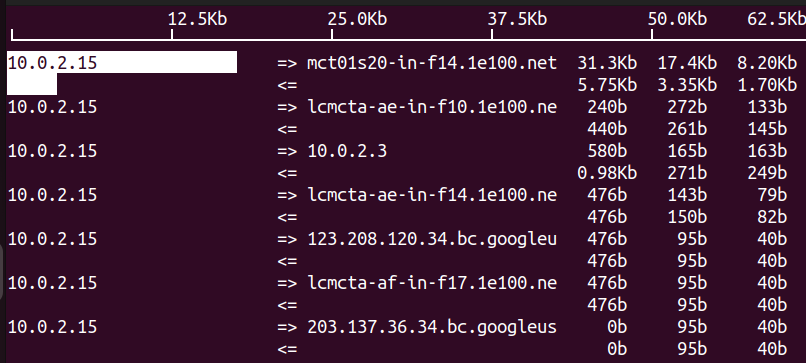
Displaying Port Information with -P
Using the -P flag shows source and destination ports for each connection. This is helpful for identifying which services or applications are generating traffic:
It immediately reveals whether HTTP, SSH, or other protocols are responsible for bandwidth usage.
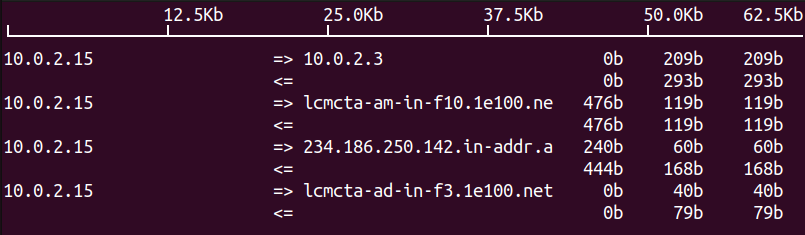
Turning Off Hostname Resolution with -n
By default, iftop resolves IP addresses into hostnames, which can slow down output. The -n flag disables name resolution and shows raw IPs for faster performance:
This is especially useful on high-traffic servers where speed matters.
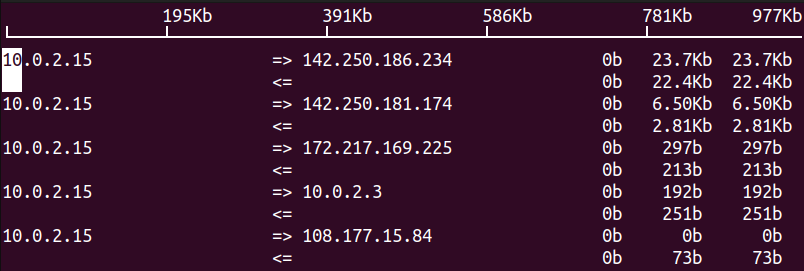
Sorting by Source, Destination, or Total
First, start iftop on your main interface:
Once iftop is running, you can change how the traffic is sorted:
Press s to sort by source IP. Press d to sort by destination IP. Press t to sort by total bandwidth usage.
This makes it easy to spot which IPs or services are consuming the most bandwidth.
Conclusion
In this article, we considered why tracking network performance is an important part of keeping a VPS fast, stable, and dependable. We thought about normal issues like bandwidth spikes, latency, and jitter and described how early detection can help reduce downtime and waste.
We then described indtalling and using bmon and iftop, which are both light-weight tools that provide real-time visibility into network usage. bmon allows visualization of bandwidth by interface and iftop provides metrics for connections utilizing data. Both tools provide visibility into network data, which can assist with troubleshooting and optimization. With the early detection offered by both tools, you can take action to maintain stable performance, reduce risk, and remediate any network issue before it becomes a major problem.
